
Abstract
The purpose of this autosomal DNA research study is to investigate whether the shared autosomal DNA that is reported for members of an endogamous population is inherently different from that of a heterogeneous population, and if so, to identify and characterize the qualitative and quantitative differences. As part of this study, we identify, describe, and quantify observed differences in autosomal DNA test results for Jewish, non-Jewish, and interfaith populations, and investigate the possible explanations for these observed differences.
This study analyzes data from Family Tree DNA’s (FTDNA’s) Family Finder test for 100 study participants, divided into Jewish, non-Jewish, and interfaith study groups. It examines how reported autosomal DNA test values, such as the size and number of shared DNA segments, the number of genetic matches, and the distribution of predicted relationships, varies between study groups. The study also investigates how shared autosomal DNA, and longest block values vary by strength-of-relationship for each study group.
The results of this investigation shed light on the differences in autosomal DNA characteristics for Jewish and non-Jewish populations. The authors suggest several refinements to FTDNA’s Family Finder test algorithm and reporting methods to increase their specificity, precision, and relevance for highly endogamous populations such as the Ashkenazi Jewish population.
Background
Ashkenazi Jews or Ashkenazim (“The Jews of Germania”) is a descriptive term for the descendants of Jews who emerged from the Holy Roman Empire around the turn of the first millennium, and established communities in Central and Eastern Europe.1 Although they are now dispersed throughout the world, approximately 75-85 percent of the world’s Jewish population is of Ashkenazi origin.2
Ashkenazi Jews are one of many known endogamous populations. Endogamy is the custom of marrying only within the limits of defined communities, tribes or clans.3 Endogamy among Ashkenazi Jews was internally mandated through religious and cultural tenets that endorsed marrying other Jews, and externally imposed through laws that prohibited marriage to non-Jews.4 In addition, severe restrictions were placed upon Jewish movements, places of residence, and marriage rights within small shtetls in Eastern Europe and the Russian Pale of Settlement.
As a result of all these factors, the Ashkenazi Jewish population is highly endogamous.56 Hence, different Jewish communities around the world share more than just religious or cultural practices — they also have strong genetic commonalities.7
For the Ashkenazi population, one consequence of their history of endogamy is that the frequency of disease-causing alleles did not decrease, but remained at increased incidence.8 As a result, they have an increased risk of certain genetic diseases, most of which are autosomal recessive and have early childhood onset.91011
Autosomal DNA Testing
In the same manner that the frequency of disease-causing alleles remains at increased incidence among Ashkenazi Jewish population, it is reasonable to expect that other alleles and markers of genetic inheritance also remain at an increased incidence. Anecdotal evidence based upon the results of genetic testing has indicated this to be the case.
For instance, it has been known for some time by DNA testing laboratories that autosomal DNA test results for endogamous populations are substantially different from those of heterogeneous populations, and Ashkenazi Jews who have undergone autosomal DNA testing have anecdotally reported that they have a very high number of matches and their predicted relationship distances to known relatives are often closer than their actual or confirmed relationships would otherwise indicate.
In an attempt to correct or adjust for this “over-predicted” relationship problem, including excess matches, DNA testing laboratories have employed various adjustment or “down-weighting” factors. To cite one such example, for individuals of Jewish ancestry, FTDNA presents the following message on its Learning Center pages:12
Using Family Finder results for genealogy is more challenging for individuals of Jewish ancestry because of a lack of genealogical records, surname changes, and frequent intermarriage…
As a result of frequent intermarriage, a Family Finder cousin match may show a total value of centiMorgans composed from the combination of different lines. That is, they are a more distant cousin who is related in multiple ways…
Beginning on April 21, 2011, we have modified our Family Finder matching algorithm to address this. The changes affect the match list for Ashkenazi Jews. The outcome is calculated Family Finder relationships that more accurately reflect relationships to other Ashkenazi Jews.
Although such down-weighting factors may, on average, provide more accurate relationship predictions, such factors do not explain or address the fundamental genetic characteristics which underlie the need for such adjustments. More specifically, they do not address the question of whether the nature of the shared autosomal DNA among members of an endogamous population is inherently different from that of a heterogeneous population, and if so, how it is different.
This underlying genetic research question lies at the heart of why genetic match rates for endogamous populations such as Ashkenazi Jews differ significantly from those of heterogeneous populations, and why a significant percentage of these reported matches may not share a common ancestor within genealogically relevant time frames.
Recent Genealogical DNA Studies
A large number of Y-DNA and maternal DNA (mtDNA) studies have been conducted for the purpose of exploring ancient Jewish origins, or for the purpose of researching the underlying genetic causes of myriad diseases to which Ashkenazi Jews have been found to be at increased risk.1113141516
In one such recent Y-DNA study of Ashkenazic and Sephardic Jewish communities from around the world, the authors stated: “The shared genetic elements suggest that members of any Jewish community are related to one another as closely as are fourth or fifth cousins in a large population, which is about 10 times higher than the relationship between two people chosen at random off the streets of New York City.”1617
Because autosomal DNA is not passed down from generation-to-generation largely unchanged as are Y-DNA and mtDNA, its usage as a lineage marker has been largely overlooked. As a result, relatively few studies have employed it for the purpose of Jewish genealogical research.1819
Recently, in an autosomal DNA study of descendants of the Wertheimer and Wertheim rabbinical lineages, the authors found that the descendants of both lineages often shared matching DNA sequences on a specific region of the 9th chromosome. The frequency of occurrence of these matching DNA sequences or chromosome markers was found to be significantly (8.8 times) higher among descendants of the Wertheimer and Wertheim rabbinical lineages than among a control group (p = << 0.001). The authors concluded that the descendants of these two famous rabbinical dynasties are genetically linked, and that Rabbi Aryeh Leib Wertheim of Bendery (c. 1780-1854) was most likely either a direct descendant of Rabbi Samson Wertheimer of Vienna (1658-1724), or that they shared a common ancestor.19
According to conventional genetic theories of inheritance and independent assortment, since autosomal DNA undergoes recombination every generation, the odds of a specific allele or chromosome marker being passed down from a particular ancestor decreases, on average, by half with each passing generation. For this reason, FTDNA does not recommend use of the Family Finder test to identify relatives whose common ancestor is more than five generations back in time.20
Despite this theoretical limitation, however, in their Wertheimer-Wertheim study, the authors found the Family Finder test potentially useful for identifying genetic matches whose common ancestor may be as far as ten generations back, as well as for identifying a possible chromosome marker among their descendants. Hence, the results of Wertheimer-Wertheim study suggested that autosomal DNA characteristics of the endogamous Ashkenazi Jewish population might be very different from what mathematical models predict for heterogeneous populations.19
One possible explanation that was offered for both the persistence and the high frequency of occurrence of the chromosome marker that was identified in the Wertheimer-Wertheim study is the reinforcement and recombination of the genes due to frequent consanguineous marriage among cousins of those rabbinical lineages. Both the Wertheimer and Wertheim rabbinical dynasties had large numbers of descendants, and made it a priority to ensure that their children married into prominent rabbinical lineages.21
How does endogamy affect the chances of a specific chromosome segment being passed down from a particular ancestor when that ancestor may appear multiple times in the family tree? Do centuries of consanguineous marriage alter the odds of inheritance, or the amount of shared DNA, and will it significantly alter genetic match rates in successive generations?
These basic genetic genealogy questions, raised anew by the findings of the Wertheimer-Wertheim study, led the authors to embark on this follow-up research study. These are the types of fundamental research questions that must be addressed if autosomal DNA analysis is to be relied upon as a genealogical research tool that is capable of producing accurate and reliable results for endogamous as well as heterogeneous populations.
The objective of this research study is to attempt to shed light on these types of fundamental research questions, by elucidating observed differences in autosomal DNA characteristics between Jewish and non-Jewish populations, based upon a detailed analysis of the results of FTDNA’s Family Finder test.
Methods
Study Groups
Participants for the study were selected on the basis of having taken the FTDNA Family Finder test, their ethnic background, their number of known relationships, and their willingness to participate in the study. All participants in the study were asked to join our FTDNA Autosomal Research project which allowed the authors to access to their Family Finder match lists and shared DNA segment data through the FTDNA project administration portal.
A total of 100 study participants were divided into Jewish, non-Jewish, and interfaith study groups. The Jewish and non-Jewish study groups each contained 40 participants, while the interfaith study group contained 20 participants. Each study participant was asked to verify that they met selection criteria regarding their ancestral background. Family Finder accounts for some of the participants were managed by their relatives or project managers, who submitted the requested data on their behalf. In all cases the relatives or project managers had the approval of the participants to access their data, and for their data to be included in the study.
With the exception of four study participants who were uncertain of their ethnic ancestry, all of the Jewish study participants in the Jewish and interfaith study groups were of primarily Ashkenazi ethnic origin. All study participants were asked to check the accuracy of any known relationships they had assigned, and to provide supporting documentation in the form of a description or family tree.
Family Finder Data
FTDNA provides each individual with a list of genetic matches in their database based on a proprietary matching autosomal DNA algorithm. The individual may sort or filter this match list based on different criteria, including filtering the list to show other individuals who share the same genetic matches as they do (In Common With or ICW matches). FTDNA also provides a list of all DNA segments shared with an individual’s genetic matches.
Because upgrades and updates of the Family Finder algorithm and database happen at regular intervals, the date for the download of data was selected in consultation with Bennett Greenspan, founder and president of FTDNA, to ensure the consistency of the downloaded data files, and to coordinate with the date of FTDNA’s estimates of the size of the Family Finder database. The Family Finder match list and shared DNA segment data files for all 100 study participants were downloaded from the FTDNA website on February 14, 2014. These data files were produced in accordance with the National Center for Biotechnology Information (NCBI) Build #37.22
Each Family Finder match list contains the following genetic and genealogical information: the full names and email addresses of each individual in the Family Finder database that FTDNA has determined matches the test subject on the basis of their shared autosomal DNA; the date of the match, the relationship range, the suggested relationship, the amount of shared DNA and length of longest block, and of the match showing direct ancestors (if provided by the test subject). In addition, if the test subject or the account manager has assigned known surnames in their ancestry, designated known relationships on their match list, and/or provided a family tree, this information is also shared with their potential genetic matches. According to Bennett Greenspan, there are approximately 5,100 individuals who have some Jewish ancestry in the Family Finder database. This provides a reasonable estimate for the total denominator of the interfaith heritage group.28
Data Analysis
As noted above, individual match lists and chromosome segment files were downloaded for all participants through the project administration portal at FTDNA. Data analysis was performed using Microsoft Excel 2013 (spreadsheet) and Microsoft Access 2013 (database). All downloaded match lists were combined into one Excel file by means of a VBA (Visual Basic) macro. Match lists were reviewed and adjusted for names that could cause significant errors in the calculations including blank names and names which included non-English characters.
The combined match list and the combined chromosome segment list for all study participants were then imported into two Microsoft Access 2013 database tables. The list of participants was also imported into a Microsoft Access 2013 table. Access queries were then created and executed to produce counts of the total number of matches for each study participant, matches in common, shared segments, and related data analyses, as presented in the results.
Data integrity checks were performed throughout the analysis process. These data integrity checks compared global totals (number of matches, number of segments, total cM) to totals contained in results of the Access queries and in the resulting analyses. Differences attributed to duplicate match names resulted in less than 0.5% difference between global totals and totals in the analyses.
Results
Ethnic Admixture – myOrigins
In the first step of our analysis, we used FTDNA’s Population Finder tool to investigate the bio-geographical ancestral composition of our study groups. The population studies utilized by the Population Finder tool were derived from the Human Genetic Diversity Project at Stanford University and other published studies.232425
Recently, we updated our ancestral composition findings using FTDNA’s new ethnic admixture tool: myOrigins. According to FTDNA, myOrigins utilizes 22 population clusters in 7 major geographic groups to evaluate an individual’s biogeographic ethnicity or ancestry as compared to these groups, many of which are quite ancient. The 7 major geographic regions include: African, Central/South Asian, East Asian, European, Jewish Diaspora, Middle Eastern, and New World.26
According to FTDNA, there are many ways to represent genetic distance and clustering between individuals and populations. A classic method is Principal Component Analysis, which was the model used by the former Population Finder admixture tool. In contrast, the new myOrigins admixture tool utilizes model-based admixture analysis using multi-locus data. Foremost among the statistical analysis packages which have emerged that operate within the model-based admixture framework is the Admixture software program, which has widely become the standard model-based admixture analysis package, and is the one utilized by the myOrigins admixture tool.27
As shown in Figure 1, the 40 participants in the Jewish study group were found to be of primarily Jewish Diaspora descent. Their Jewish Diaspora ancestral percentages ranged from 79 to 100 percent (mean = 93 %; SD = 6.7 %). The 40 participants in the non-Jewish study group were found to be of primarily European descent. Their European ancestral percentages ranged from 72 to 100 percent (mean = 97 %; SD = 6.4 %).
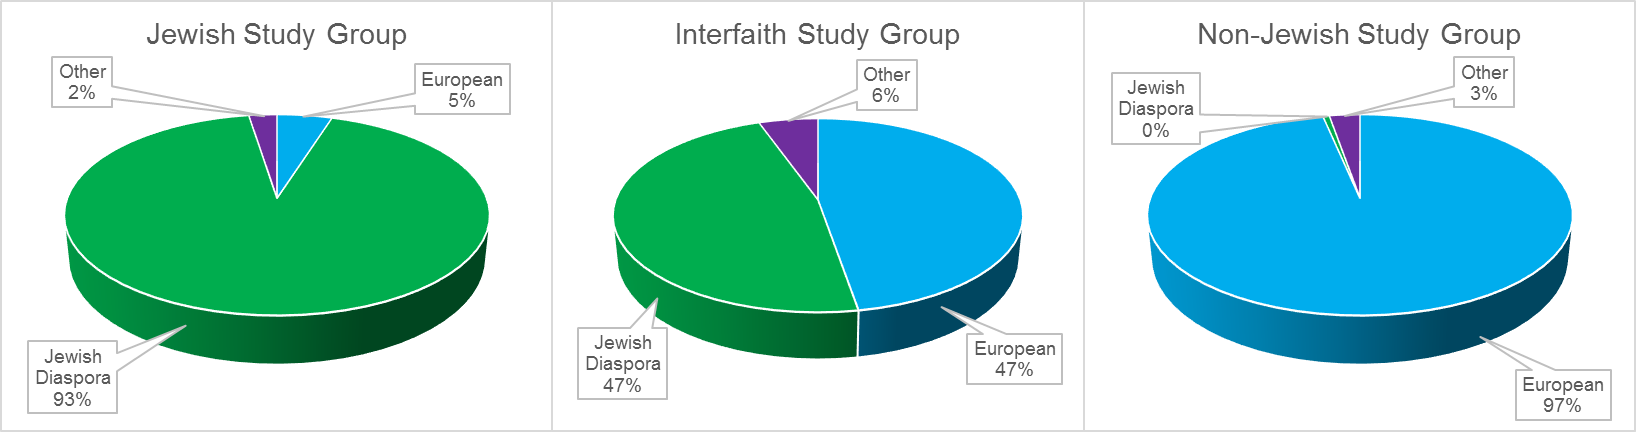
Fig. 1: Bio-Geographical Ancestral Composition of the Jewish, Non-Jewish, and Interfaith Study Groups
On average, the 20 participants in the interfaith study group were found to have approximately half Jewish Diaspora ancestry (mean = 47 %, SD = 6.2 %) and half European ancestry (mean = 47 %, SD = 10.7 %). Jewish Diaspora ancestral percentages ranged from 34 to 56 percent and European ancestral percentages ranged from 20 to 66 % in the interfaith study group. The two individuals with relatively low European ancestral percentages (20 and 22 %) had relatively high Middle Eastern ancestral percentages (25 and 24 %, respectively).
In general, FTDNA’s myOrigins admixture tool appears to represent a significant upgrade over their previous Population Finder tool. The equal percentages (47%) of Jewish Diaspora and European ancestry reported for the members of the interfaith study group is exactly what would be expected for the first generation offspring of Jewish and non-Jewish parents. In contrast, the admixture results we found using the Population Finder tool had significantly underestimated the Jewish Diaspora percentage among the interfaith study group.
Observed Differences in Family Finder Match Rates
The next step in our analysis was to investigate the extent to which matches predicted by FTDNA (genetic relatives based upon matching autosomal DNA) between Ashkenazi Jews and non-Jews occur by conducting an inter-participant match analysis. This was accomplished by calculating the number of times that FTDNA determined that a study participant was a genetic match to another study participant, and then summarizing the results by study group. The inter-participant match rate data for the three study groups are summarized in Table 1.
Jewish Study Group
Interfaith Study Group
Non-Jewish Study Group
Matches N
Matches Mean N
Match (%)
Matches N
Matches Mean N
Match (%)
Matches N
Matches Mean N
Match (%)
Jewish Study Group
992
24.8
62.0
293
7.3
36.6
4
0.1
0.3
Interfaith Study Group
293
14.7
36.6
94
4.7
23.5
9
0.5
1.1
Non-Jewish Study Group
4
0.1
0.3
9
0.2
1.1
158
4.0
9.9
The 40 participants in the Jewish study group were found to match an average of 24.8 or 62.0 % of the other Jewish study participants, while the 40 participants in the non-Jewish study group matched an average of 4.0 or 9.9 % of the other non-Jewish study participants. Hence, Jewish study participants had over 6 times more matches with each other than did non-Jewish study participants (62.0/9.9 = 6.26).
With the exception of a single study participant, there were no matches between the Jewish and non-Jewish study groups. The single exception was a non-Jewish participant who matched four participants in the Jewish study group. The total number of genetic matches on this individual’s Family Finder match list (1139), a significant proportion of which were Jewish, indicates that they had a relatively recent Jewish ancestor, most likely one of their grandparents.
As anticipated, the interfaith study group had an intermediate number of matches. The 20 participants in the interfaith study group matched an average of 14.7 or 36.6% of the Jewish study participants, 4.7 or 23.5% of the interfaith study participants, and 0.5 or 1.1 % of the non-Jewish study participants.
We then evaluated and compared the total number of matches in the entire Family Finder database among the participants in each of our three study groups. These results are summarized in Table 2.
Total Number of Matches
Average Ratio of Matches between Study Groups
Minimum
Maximum
Mean
Jewish
Study
Group
Interfaith
Study
Group
Non-Jewish
Study
Group
Jewish Study Group
2403
3245
2777
1.0
1.6
4.1
Interfaith Study Group
1042
2054
1701
0.6
1.0
2.5
Non-Jewish Study Group
95
1139
672
0.2
0.4
1.0
The total number of matches in the entire Family Finder database among the 40 participants of the Jewish study group ranged from 2,403 to 3,245, with a mean value of 2,777 (SD = 230). The total number of matches among the participants of the non-Jewish study group ranged from 95 to 1,139, with a mean value of 672 (SD = 238). The difference in mean values between the two groups was found to be highly significant (t-Test, p << 0.001).
As anticipated, the total number of matches among the participants of the interfaith study group fell in-between the totals for the Jewish and non-Jewish study groups, ranging from 1,042 to 2,054, with a mean value of 1,701 (SD = 274).
Jewish study participants had an average of 4.1 times more matches than non-Jewish study participants, and 1.6 times more matches than interfaith study participants, while interfaith study participants had an average of 2.5 times more matches than non-Jewish study participants.
When the data are normalized to adjust to the size of the Family Finder database, the differences between the three groups are even more striking. There are currently approximately 3,381 Jewish individuals with four Jewish grandparents in the Family Finder database, 1,719 of mixed Jewish/non-Jewish ancestry and 77,360 individuals of non-Jewish ancestry.28 The 40 Jewish study participants had a mean of 2777 matches, which means that on average, they matched 54.5% of the Jewish population (including individuals of mixed Jewish /non-Jewish heritage) in the Family Finder database.
In contrast, the 40 non-Jewish study participants had a mean of 672 matches, which means that on average, they matched 0.8 % of the individuals of non-Jewish or mixed Jewish ancestry in the Family Finder database. As anticipated, the 20 interfaith study participants were in-between; they had a mean of 1701 matches, which means that on average, they matched 2.1% of the individuals of Jewish, non-Jewish, or mixed Jewish background in the Family Finder database.
The odds of finding a Jewish vs. a non-Jewish match for someone taking the Family Finder test is therefore (54.5/0.8) or 68-to-1, and the odds of finding an interfaith vs. a non-Jewish match for someone taking the Family Finder test is (2.1/0.8) or 2.6-to-1. These results are summarized in Table 3.
Calculation of Match Rates
Ratio of Match Rates between Study Groups
Matches Mean N
Number of Individuals in the Family Finder Database
Match (%)
Jewish Study Group
Interfaith Study Group
Non-Jewish Study Group
Jewish Study Group
2777
Jewish (3381) + Mixed (1719) = 5100
54.5
1.00
25.95
68.13
Interfaith Study Group
1701
Jewish (3381) + Mixed (1719) + Non-Jewish (77360) = 82460
2.1
0.04
1.00
2.63
Non-Jewish Study Group
672
Mixed (1719) + Non-Jewish (77360) = 79079
0.8
0.01
0.38
1.00
In Common With (ICW) Matches
We next evaluated the number of matches in common (In Common With or ICW) among the participants of each study group. This is equivalent to the number of matches that any two participants in each study group share with one another. These matches and their predicted relationships are identified by FTDNA based upon shared autosomal DNA. These results are presented in Table 4.
Jewish
Interfaith
Non-Jewish
ICW Matches
Percentage (%)
ICW Matches
Percentage (%)
ICW Matches
Percentage (%)
Close & Immediate
0.6
0.0
1.3
0.2
0.8
0.9
1st Cousin
0.1
0.0
0.1
0.0
0.3
0.4
2nd Cousin
3.8
0.3
0.5
0.1
0.7
0.8
3rd Cousin
27.9
2.0
8.2
1.1
7.9
9.3
4th Cousin
208.0
15.2
95.3
12.3
16.6
19.5
4th to Remote Cousin
398.9
29.1
214.1
27.6
20.5
24.1
5th to Remote Cousin
729.7
53.3
456.3
58.8
38.2
44.9
Mean Total ICW Matches
1,369
100
775.8
100
85.1
100
As shown by the data in Table 4, Jewish study participants had an average of 1369/85 = 16.1 times more matches in common with other study participants than did non-Jewish study participants. The difference in mean ICW values between the Jewish and non-Jewish groups was found to be highly significant (t-Test, p << 0.001). Jewish study participants had an average of 1369/776 = 1.8 times more ICW matches than interfaith study participants, and interfaith study participants had an average of 776/85 = 9.1 times more ICW matches than non-Jewish study participants, reflecting the effect of Jewish matches. The vast majority of ICW matches for all three study groups are speculative matches with 4th-to-remote and 5th-to-remote cousins. These results are graphically depicted in Figure 2.
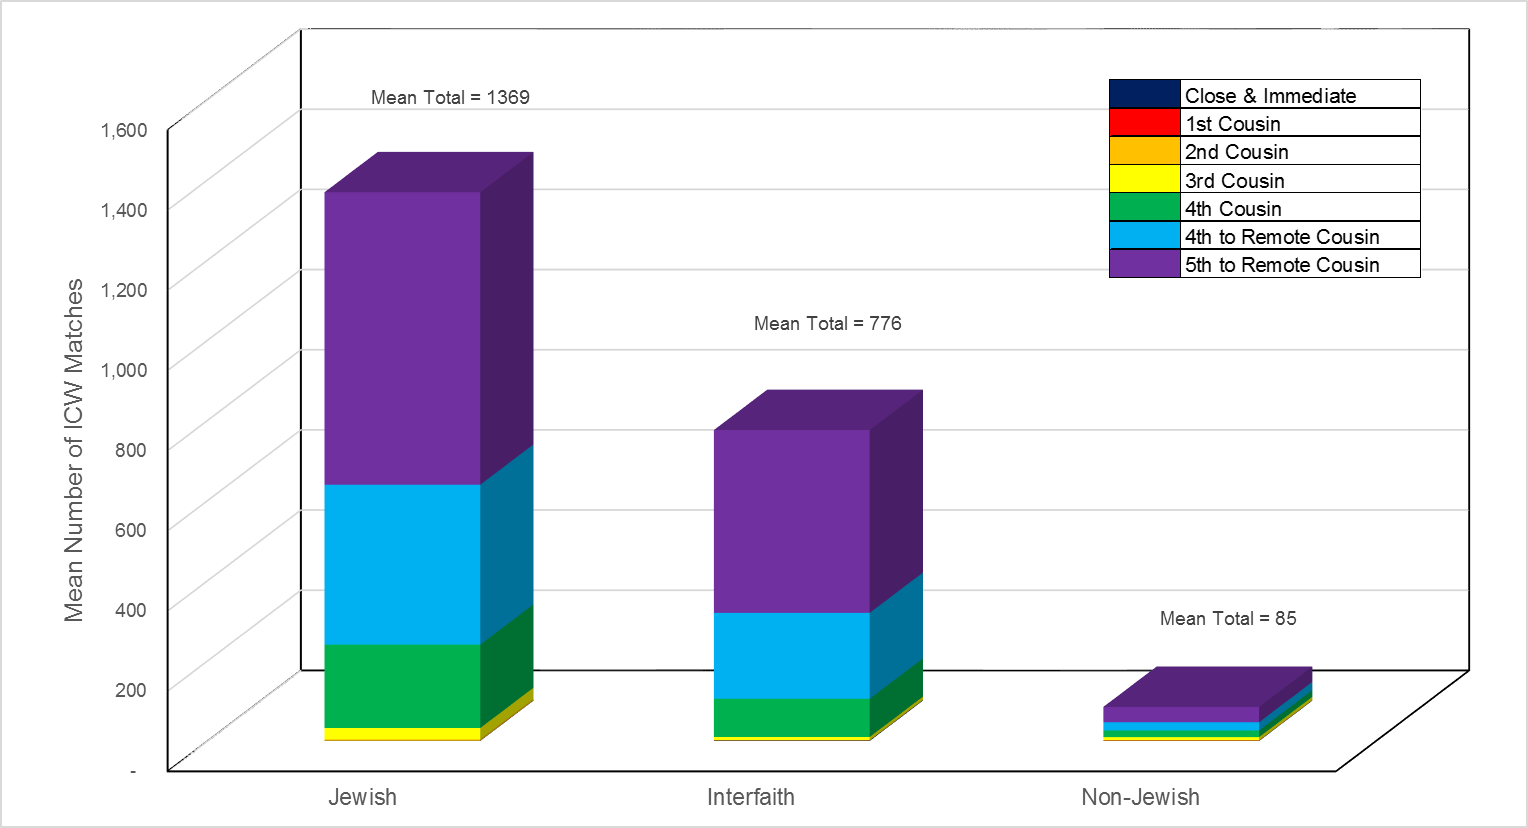
Fig. 2: Mean In-Common-With (ICW) Matches by Predicted Relationship
Matches by Predicted Relationship
The Family Finder test uses a proprietary algorithm to identify potential genetic matches in the Family Finder database, and to predict the likely relationship between them. To investigate whether there are significant differences in the type and distribution of predicted relationships for endogamous versus heterogeneous populations, we conducted an analysis of the mean number of Family Finder matches by predicted relationship for participants of the Jewish, non-Jewish, and Interfaith Study Groups. These results are presented in Table 5.
Jewish
Interfaith
Non-Jewish
Mean Matches N
Percentage (%)
Mean Matches N
Percentage (%)
Mean Matches N
Percentage (%)
Close & Immediate
0.9
0.03
2.4
0.14
1.4
0.20
1st Cousin
0.2
0.01
0.3
0.01
0.7
0.10
2nd Cousin
6.0
0.22
1
0.05
2
0.24
3rd Cousin
52.0
1.88
20
1.15
47
7.04
4th Cousin
397.0
14.3
196
11.5
113
16.8
4th to Remote Cousin
786.0
28.3
447
26.3
157
23.3
5th to Remote Cousin
1534
55.3
1035
60.9
352
52.4
Mean Total Matches
2777
100
1701
100
672
100
As summarized in Table 5, the composition of predicted match relationships was generally similar between the three study groups. All three study groups had less than 1% of their predicted relationships in the immediate & close family relationship category, including 1st and 2nd cousins; about one-quarter of their matches fall in the predicted 4th-to Remote cousin category, and about half of their matches fall in the predicted 5th-to-Remote cousin category.
Non-Jewish study participants did have an almost 4-fold higher percentage of predicted 3rd cousin relationships than Jewish participants (7.04% compared to 1.88%), but this may have simply been an artifact of the Jewish denominator being so much larger due to the presence of so many remote cousins.
Study Hypothesis
If the FTDNA Family Finder algorithm is resulting in a similar distribution of predicted relationships for the Jewish versus the non-Jewish study groups, then why do Jewish study participants have so many more genetic matches than both non-Jewish and interfaith study participants? To explain this dramatic difference in the total number of matches and match rates, we hypothesized that Ashkenazi Jews share more total autosomal DNA and more DNA segments with their genetic matches in the FTDNA Family Finder database than do non-Jews. If this hypothesis is found to be correct, it would explain the higher number of Jewish matches being identified.
Differences between Expected and Observed Shared Autosomal DNA for Known Relationships
In order to test our hypothesis, we investigated the relationship between expected shared DNA values, and actual shared DNA values reported by the Family Finder test, by calculating the mean shared DNA values in cM for each level of known relationship for each study group, and comparing these values to the expected amount of shared DNA, to see how the two values differed at various relationship distances.
Expected shared DNA percentages are based on the assumption that in general, an average amount of DNA that is shared with an ancestor decreases by 50% with each additional generation, and follows the table presented in the FTDNA Family Finder Q & A document.29 The data in the expected shared cM column were estimated by calculating the mean cM value reported for the closest known relationship (parent/child) between our study participants and their matches, and proportioning it according to expected shared DNA percentages. These results are presented in Table 6.
In regard to the expected percentage of shared autosomal DNA between siblings, full siblings share approximately 50% of their DNA but current technology does not differentiate between the two copies (maternal and paternal) of each chromosome. If DNA is shared on the same spot on both copies, it is reported as if it was only shared on one copy. This effectively reduces the reported shared DNA for full siblings to approximately 37.5%.
e.g. Of participants in the Jewish Study Group, there were 20 (N) matches in the FTDNA database whose genealogical relationship is known to be parent/child. The mean CM match of these 20 matches was 3,381 CM. * Full siblings share approximately 50% of their DNA but current technology does not differentiate between the two copies (maternal and paternal) of each chromosome. If DNA is shared on the same spot on both copies, it is reported as if it was only shared on one copy. This effectively reduces the reported shared DNA for full siblings to approximately 37.5%. 1R and 2R designate cousins of different generations; 1R= “once removed,” 2R = “twice removed.” ** Other known relationships consist of 7th and 9th cousins 1R; 8th cousins; other half cousins; other great and 2nd great aunts/uncles, and other cousins beyond 2R.
Expected Shared Autosomal DNA
Actual Shared Autosomal DNA (Mean cM)
Jewish Study Group
Non-Jewish Study Group
Interfaith Study Group
Relationship Distance
Expected Shared %
Expected cM Value
Mean cM of Matches
Number of Values
Mean cM of Matches
Number of Values
Mean cM of Matches
Number of Values
Parent/Child
50.00
3380
3,381
20
3,383
21
3,382
17
Sibling*
37.50
2535
2,578
4
2,640
12
2,610
13
Half-Sibling
25.00
1690
1,754
1
1,731
4
1,614
5
Grandparent
25.00
1690
1,877
1
2,068
1
1,696
4
Aunt/Uncle
25.00
1690
1,748
10
1,800
16
1,764
7
1st Cousin
12.50
845
886
6
847
22
880
2
Half Great Aunt / Uncle
6.250
423
376
5
516
1
n/a
0
Half 1st Cousin
6.250
423
n/a
0
351
5
n/a
0
1st Cousin 1R
6.250
423
480
14
496
30
477
4
1st Cousin 2R
3.125
211
304
2
193
4
306
7
2nd Cousin
3.125
211
274
29
296
14
229
7
2nd Cousin 1R
1.563
106
183
21
109
17
115
11
2nd Cousin 2R
0.781
52.8
209
3
86
6
111
1
3rd Cousin
0.781
52.8
198
11
79
35
81
9
3rd Cousin 1R
0.391
26.4
173
9
62
37
106
4
3rd Cousin 2R
0.195
13.2
94
4
57
10
n/a
0
4th Cousin
0.195
13.2
83
4
52
16
40
2
4th Cousin 1R
0.098
6.602
103
6
55
18
75
3
4th Cousin 2R
0.049
3.301
112
3
45
3
63
3
5th Cousin
0.049
3.301
141
6
43
23
47
6
5th Cousin 1R
0.024
1.650
84
5
51
8
54
3
6th Cousin
0.012
0.825
162
3
35
9
n/a
0
6th Cousin 1R
0.006
0.413
156
2
39
3
n/a
0
7th Cousin
0.003
0.206
179
1
39
6
n/a
0
Other Known Relationships **
12
8
9
Total Known Relationships
182
329
117
Several interesting trends emerge from the data presented in Table 6. For the Jewish study group, actual shared autosomal DNA values are close to expected values from the parent/child relationship through 1st cousin 1R relationship distances. From 1st cousin 2R through 7th cousin relationship distances, actual shared autosomal DNA values are significantly higher than expected values. This trend becomes progressively more pronounced at greater relationship distances. At the 5th, 6th, and 7th cousin relationship distances, for instance, the mean shared autosomal DNA value is 42.7, 196, and 869 times the expected values, respectively.
For the non-Jewish study group, actual shared autosomal DNA values are close to expected values from the parent/child relationship through 2nd cousin 1R relationship distances. From 2nd cousin 2R through 7th cousin relationship distances, actual shared autosomal DNA values are higher than expected values, but not nearly as high as for the Jewish study group. By way of comparison, at the 5th, 6th, and 7th cousin relationship distances, the mean shared autosomal DNA value is 13.0, 42.4, and 189 times the expected values, respectively.
Since expected shared autosomal DNA beyond the 4th cousin relationship distance falls well below FTDNA’s 20 cM threshold for reporting a match, only those distant cousins who share substantially more DNA than expected will be reported as matches, which influences the slope of the regression line and the Y-intercept. While the results for non-Jewish known relationships are elevated for distant relationships, the results for the Jewish study group are more than four times as high.
For the interfaith study group, actual shared autosomal DNA values are close to expected values from the parent/child relationship through 2nd cousin 1R relationship distances. Expected shared DNA percentage, based upon relationship distance, vs. mean shared autosomal DNA values for all three study groups is graphically depicted in Figure 3.
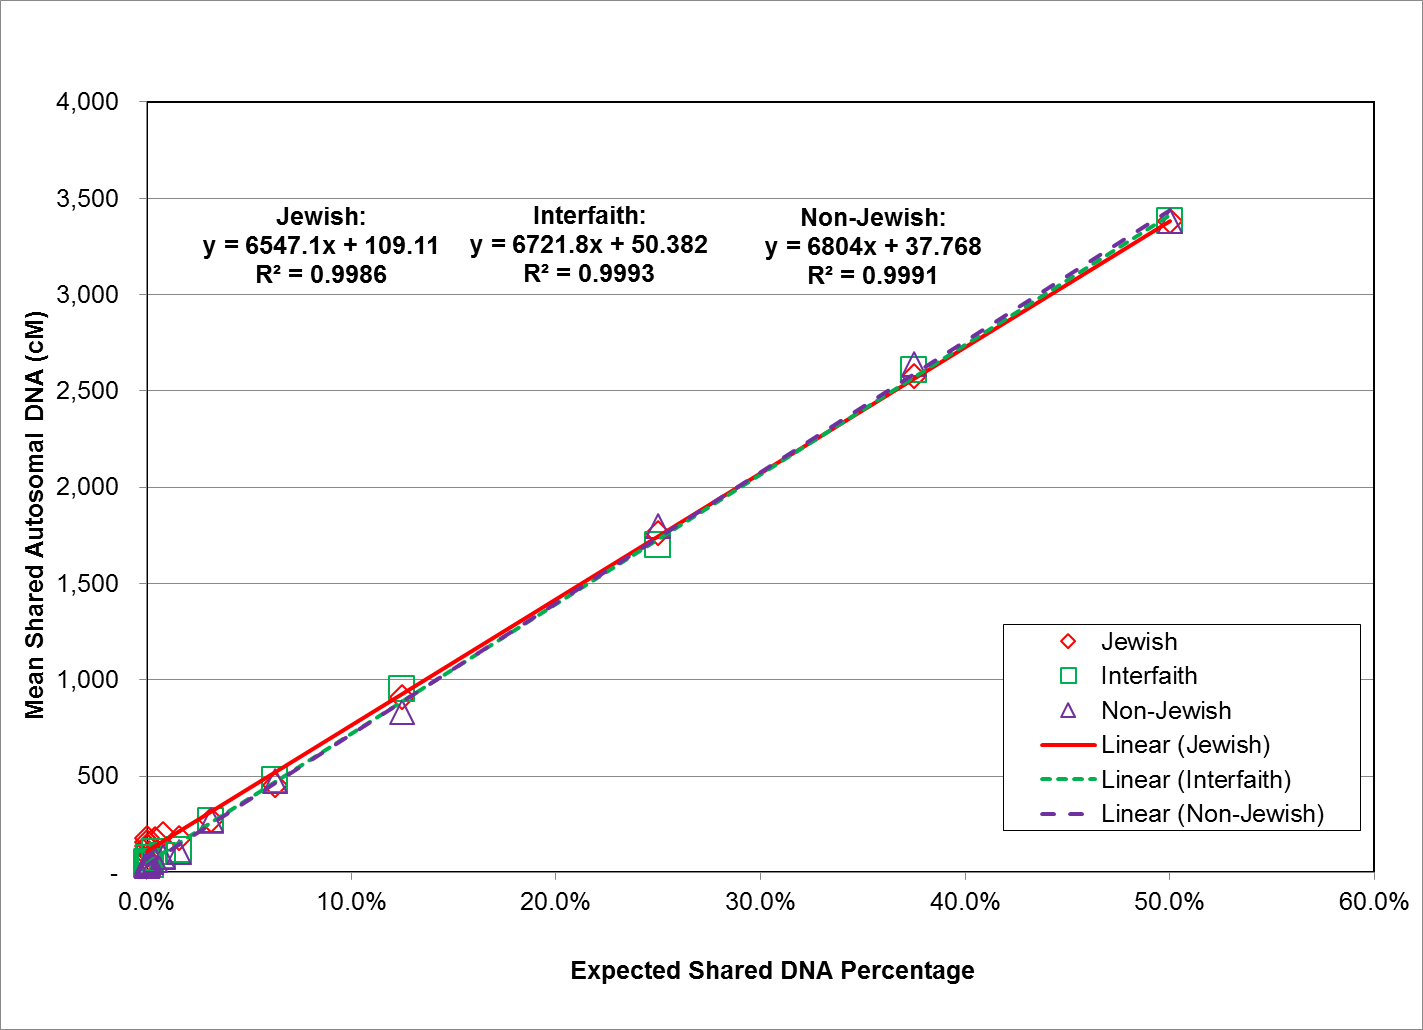
Fig. 3: Expected Shared DNA Percentage vs. Mean Shared Autosomal DNA (cM) for All Study Groups
As shown in Figure 3, the relationship between expected shared DNA percentage and observed autosomal DNA values was highly linear for all three study groups, with regression (Pearson product-moment correlation) coefficients of 0.9986 for the Jewish study group, 0.9993 for the interfaith study group, and 0.9991 for the non-Jewish study group. Because expected shared DNA percentage is derived from, and proportional to relationship distance, this means that the relationship between expected shared DNA percentage and relationship distance is highly linear as well.
This nearly perfect linear relationship conveys confidence in the accuracy and reliability of the laboratory autosomal DNA analysis, and its ability to identify and predict relationship distance based upon shared autosomal DNA values. A similar highly linear relationship was seen when expected shared DNA percentage was plotted against shared autosomal DNA longest block values.
The overall relationship between expected shared DNA percentage and observed autosomal DNA values is highly linear for all three study groups, however, the linear relationship tends to break down at low end of the expected shared DNA percentage range. Although the linear relationship diverges for all three study groups, the divergence for the Jewish study group is the most pronounced. Expected shared DNA percentage at the low end of the range (below 3.5%, equivalent to a relationship distance of 2nd cousin) vs. mean shared autosomal DNA values for all three study groups is graphically depicted in Figure 4.
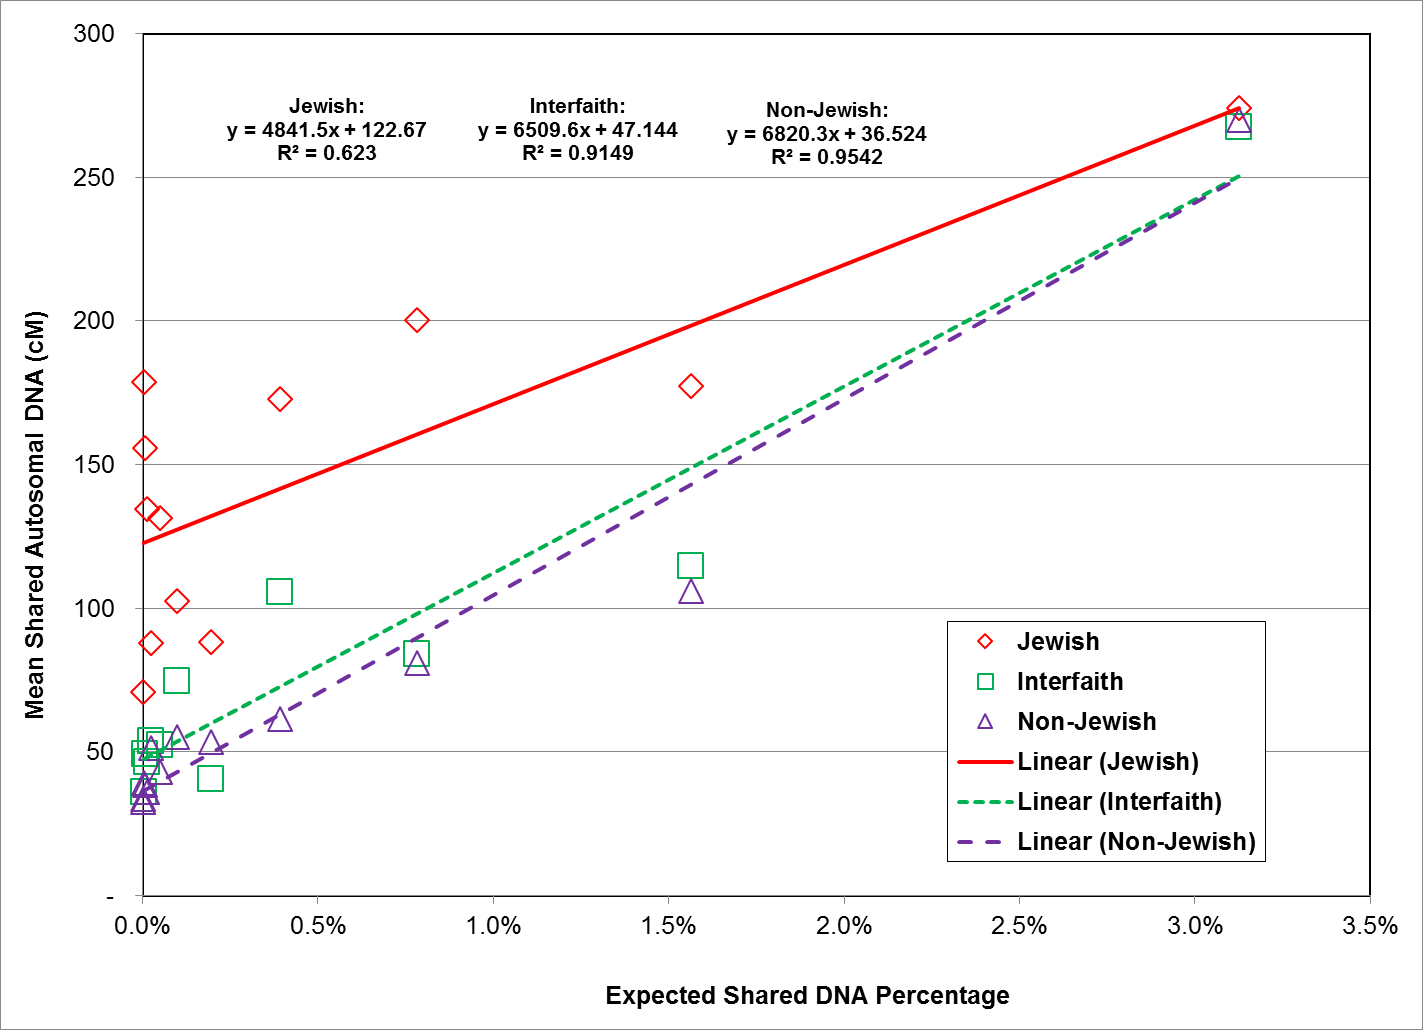
Fig. 4: Expected Shared DNA Percentage Less than 3.5% vs. Mean Shared Autosomal DNA (cM) for All Study Groups
As shown in Figure 4, the relationship between expected shared DNA percentage below 3.5% and observed autosomal DNA values displays significant differences between the three study groups. For the non-Jewish study group, the relationship is still highly linear, with an R2 value of 0.9542. The interfaith group is also still highly linear, with an R2 value of 0.9149. However, for the Jewish study group, the relationship is no longer completely linear, as evidenced by the obvious scatter in the data, and the low R2 value of 0.623.
To examine this trend in more detail, we focused on the extreme low end of the relationship distribution to investigate whether we could identify where the linear relationship between expected and observed autosomal DNA values began to break down and become non-linear. Expected shared DNA percentage at the extreme low end of the range (below 1 %, equivalent to a relationship distance of 3rd cousin) vs. mean shared autosomal DNA values for all three study groups is graphically depicted in Figure 5.
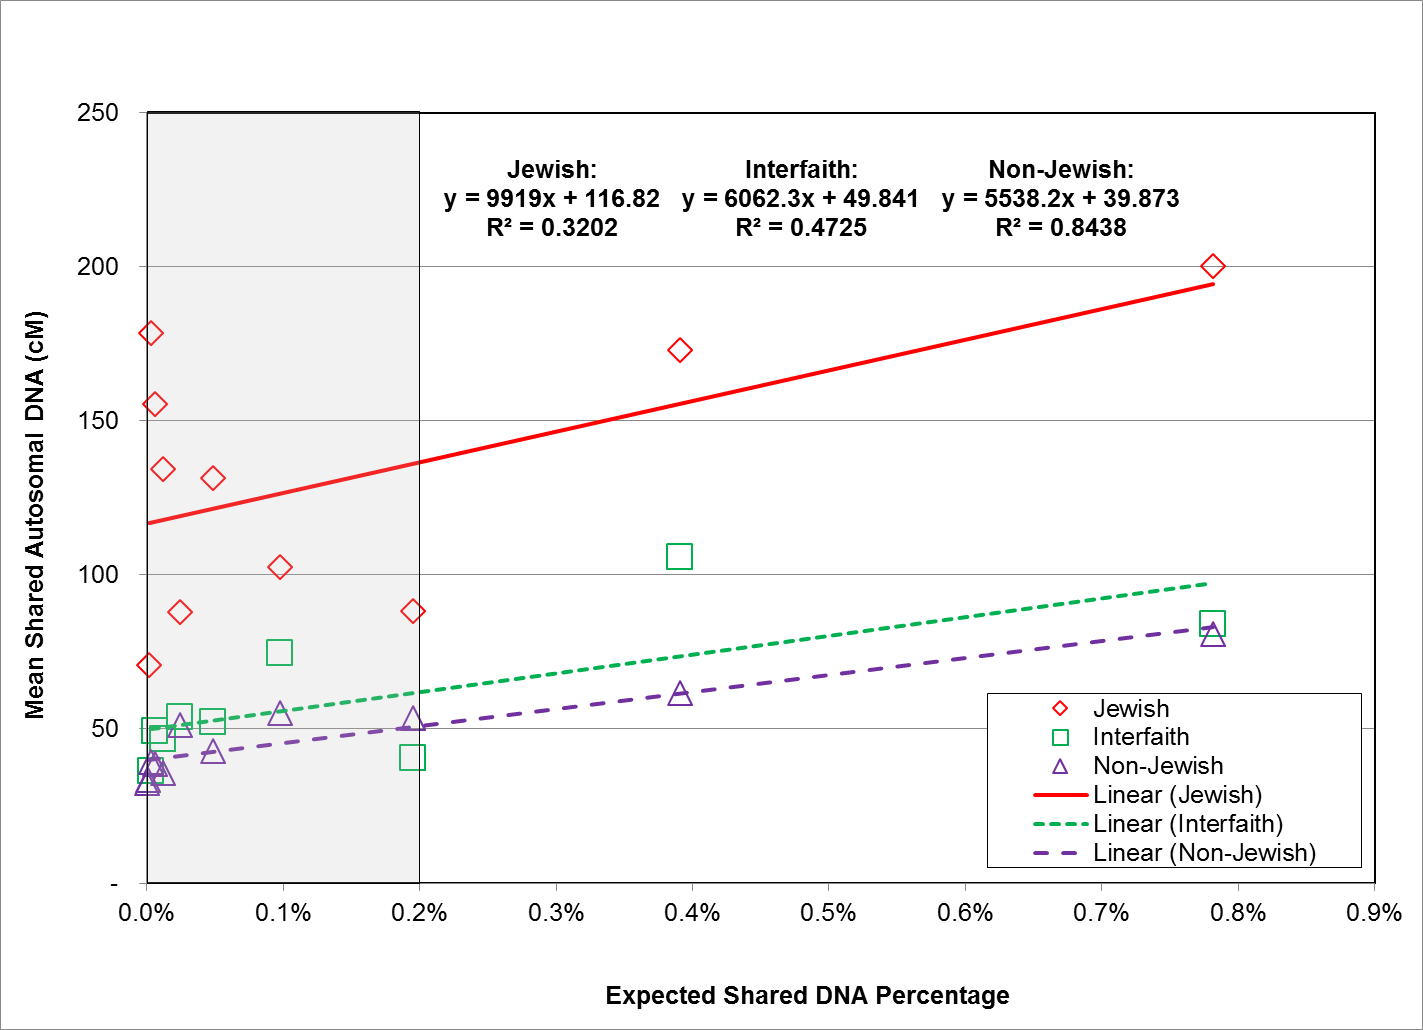
Fig. 5: Expected Shared DNA Percentage Less than 1% vs. Mean Shared Autosomal DNA (cM) for All Study Groups
As shown in Figure 5, the relationship between expected and observed shared autosomal DNA values becomes less linear at expected shared DNA percentages below 1%, and markedly so at expected shared DNA percentages below 0.2%, especially for participants in the Jewish study group. An expected shared DNA percentage of 0.2% corresponds to a relationship of 4th cousins (0.195%).
Regression coefficients of 0.3202 and 0.4725 reflect the breakdown in linearity for the Jewish and the interfaith study groups, respectively. However, the regression coefficient of 0.8438 for the non-Jewish study group shows that the relationship between actual and expected shared DNA remains fairly linear at this level. This breakdown in the linear relationship for the Jewish and interfaith study groups requires FTDNA to make additional adjustments in order to better predict relationships at distances beyond the 4th cousin level for people with substantial Ashkenazi ancestry.
A significant finding made evident by Figures 3, 4, and 5, are the differences between the Y-intercept values of the regression lines for the three study groups. As discussed above, FTDNA’s match threshold of 20 cM will result in matches only to those distant cousins who share disproportionately high amounts of DNA, well beyond the expected shared DNA value for that level of relationship, thereby artificially increasing the mean shared DNA at that level. This is why the y-intercept is greater than zero, even for the non-Jewish study group.
However, the y-intercept for the Jewish study group is much higher than that of the non-Jewish study group, representing increased shared DNA between participants in the Jewish study group and their known relationships. Taking the average of the differences between the Y-intercepts for the regression lines for the Jewish and non-Jewish study groups in Figures, 3, 4, and 5, this additional shared DNA is approximately 75 cM.
This finding supports our hypothesis that Ashkenazi Jews share more total autosomal DNA with their genetic matches than do non-Jews, as a significant difference in the amount of shared autosomal DNA between Ashkenazi Jews and non-Jews with their respective genetic matches, would greatly affect the number of predicted matches, as well as the predicted relationships of those matches among people of Jewish ancestry in the Family Finder database.
Accuracy Analysis
The results of our analysis showed there to be significant differences between expected and observed shared autosomal DNA for known relationships between our three study groups, particularly at lower expected shared DNA values. To investigate the effect of these differences on the accuracy and reliability of Family Finder test results, we conducted an analysis on the accuracy of predicted relationships for each study group at various relationship distances. These results are presented in Table 7.
Within range based on equivalent expected shared DNA percentage. Example: 3rd cousin 2R is equivalent to 4th cousin. Both have expected shared DNA percentage of 0.195% * Range used was 4th cousin to 6th cousin. ** Range used was 5th cousin and beyond. All known relationships not within range are therefore closer than 5th cousin.
Jewish Study Group
Interfaith Study Group
Non-Jewish Study Group
Predicted Relationship
N
N within Predicted Range
Accuracy %
N
N within Predicted Range
Accuracy %
N
N within Predicted Range
Accuracy %
Parent/Child
20
20
100
17
17
100
21
21
100
Full Siblings
4
4
100
13
13
100
10
10
100
Other Immediate
6
6
100
8
8
100
18
18
100
Close Family
15
14
93.3
14
14
100
31
27
87.1
1st-2nd Cousin
11
11
100
4
4
100
21
21
100
1st-3rd Cousin
26
26
100
4
4
100
21
21
100
2nd-3rd Cousin
47
35
74.5
9
9
100
18
18
100
2nd-4th Cousin
19
18
94.7
21
21
100
98
77
78.6
3rd-5th Cousin
3
2
66.7
14
9
64.3
39
32
82.1
4th to Remote *
14
12
85.7
6
4
66.7
24
15
62.5
5th to Remote **
17
9
52.9
7
6
85.7
28
20
71.4
All Categories
182
157
86.3
117
109
93.2
329
280
85.1
As demonstrated by Table 7, the accuracy of Family Finder predicted relationships are very comparable for the Jewish, non-Jewish and interfaith study groups. For parent/child, full sibling, other immediate family members, 1st – 2nd cousin, and 1st – 3rd cousin relationships, the Family Finder test predicted the correct relationship with 100% accuracy for all three study groups.
Interestingly, it predicted close family members with more accuracy for members of the Jewish study group (93.3%) and interfaith study group (100%), than for members of the non-Jewish study group (87.1%). It also predicted 2nd-to-4th cousins with more accuracy for members of the Jewish study group (94.7%) and interfaith study group (100%), than for members of the non-Jewish study group (78.6%).
At the 3rd-to-5th cousin relationship distance, the predicted relationships for the Jewish study group is less accurate than for the non-Jewish study group (66.7% vs. 82.1%). However, this result is based on only 3 known relationships in the Jewish study group, hence it is very uncertain.
At a relationship distance of 5th-to-remote cousins, predicted relationships for the Jewish study group (52.9%) are significantly less accurate than for the interfaith (85.7%) and non-Jewish study groups (71.4%). This finding is consistent with our results regarding the non-linearity of the expected vs. reported shared DNA relationship for the Jewish study group past the 4th cousin relationship distance. This non-linearity, scatter, or “background noise” in the low expected DNA region is most likely the result of DNA segments inherited through multiple ancestral relationships, which tend to persist in endogamous populations.
Differences in the Amount and Composition of Shared DNA Segments between Study Groups
Part of our hypothesis is that Ashkenazi Jews share more DNA segments with their genetic matches than do non-Jews. In order to test this part of our hypothesis, we looked at the number of shared DNA segments for each study participant’s matches, summed the totals, calculated the means, and compared them between study groups. The number of shared DNA segments was grouped by segment size to give us a better idea of where these extra segments (and hence the extra shared DNA) was coming from. These results are presented in Tables 8 and 9.
Jewish
Interfaith
Non-Jewish
DNA Segment Length (cM)
Segments
Percentage (%) of Total
Segments
Percentage (%) of Total
Segments
Percentage (%) of Total
< 3
10.9
50.6
8.6
57.0
8.6
74.8
3 to < 5
6.6
30.3
3.8
25.0
1.6
13.9
5 to < 8
2.8
12.9
1.5
10.3
0.2
1.9
8 to <12
1.1
5.0
0.9
6.0
0.6
5.3
12 to <15
0.2
0.7
0.1
1.0
0.2
1.5
>= 15
0.1
0.4
0.1
0.8
0.3
2.6
Mean Total
21.6
100
15.0
100
11.4
100
As shown in Table 8, Jewish study group participants share almost twice (21.6/11.4 = 1.89) as many DNA segments with their identified genetic matches as do non-Jewish study participants. The difference in the mean number of shared segments between the Jewish and non-Jewish groups was found to be highly significant (t-Test, p << 0.001).
Jewish study group participants share (21.6/15.0) 1.44 times as many DNA segments with their identified genetic matches than do interfaith study participants, and interfaith study group participants share (15.0/11.4) 1.32 times as many DNA segments with their identified genetic matches than do non-Jewish study participants.
Participants in the Jewish study group had the greatest percentage of segments between 3 cM and <8 cM (30.3% + 12.9%) = 43.2%, followed by the interfaith study group (25.0% + 10.3%) = 35.3%, and the non-Jewish study group (13.9% + 1.9%) = 15.8%. Somewhat surprisingly, participants in the non-Jewish study group had the greatest percentage of segments under 3 cM (74.8%), followed by the interfaith study group (57.0%) and the Jewish study group (50.6%).
Jewish
Interfaith
Non-Jewish
DNA Segment Length (cM)
Shared cM
Percentage (%) of Total
Shared cM
Percentage (%) of Total
Shared cM
Percentage (%) of Total
< 3
22.92
28.8
17.49
30.9
16.84
38.9
3 to < 5
25.05
31.4
14.17
25.0
5.64
13.0
5 to < 8
17.13
21.5
9.56
16.9
1.48
3.4
8 to <12
10.28
12.9
8.58
15.1
5.82
13.4
12 to <15
2.09
2.6
1.91
3.4
2.23
5.2
>= 15
2.25
2.8
4.91
8.7
11.32
26.1
Mean Total
79.72
100
56.63
100
43.32
100
As shown in Table 9, genetic matches to members of the Jewish study group share significantly more autosomal DNA (mean = 79.72 cM) than genetic matches to members of the non-Jewish study group (mean = 43.32 cM), a difference of 36.4 cM. The difference in the mean value of shared cM between the Jewish and non-Jewish groups was found to be highly significant (t-Test, p << 0.001).
DNA segments in the 3 cM to < 5 cM size range contribute 25.05 cM to the mean total for matches to members of the Jewish study group, while the same size range only contributes 5.64 cM to the mean total for matches to members of the non-Jewish study group, a difference of 19.41 cM. DNA segments in the 5 cM to < 8 cM size range contribute 17.13 cM to mean shared cM for matches to members of the Jewish study group, while the same size range only contributes 1.48 cM to mean shared cM for matches to members of the non-Jewish study group, a difference of 15.65 cM. These two size ranges account for 96.3% of the difference in mean shared autosomal DNA between the Jewish and non-Jewish study groups.
Third-Party Tools
Independent researchers constantly are developing new “third party” applications and methodologies for public use. Some, such as triangulation and admixture analysis, currently are used by the general public. Others, such as chromosome mapping and persistent segment analysis, still are being investigated and do not yet have any user-friendly computer applications associated with them.
Most ethnic admixture software programs provide percentages that take into account an individual’s autosomal DNA as a whole, but GEDmatch.com offers several options using different sets of reference populations. GEDmatch.com also provides admixture percentages for each chromosome and a “chromosome painting” tool that graphically shows the changing regional breakdown along the length of each chromosome.30 Also available from GEDmatch.com is a phasing tool that splits a person’s raw DNA data into a maternal source and a paternal source file. The phasing tool requires raw DNA data from at least one parent. The tool can be used with the admixture tools to determine better which matches come from the paternal side, which from the maternal side, and which are connected to both sides.
Researchers are exploring two related areas, chromosome mapping and persistent segment analysis. Both try to identify which segments were passed down from a particular ancestor. Chromosome mapping is concerned with identifying the genealogical source of shared segments on an individual’s chromosomes. Persistent segment analysis is concerned with identifying the segment or segments that are shared by many descendants of a particular individual who may have lived hundreds of years ago. It is also being used to prove that two lineages are genetically related. This technique was used by the first author in his autosomal DNA study of the Wertheimer and Wertheim rabbinical lineages.
Triangulation Techniques
A key component of triangulation techniques is the analysis of the DNA matches that any two people share with one another. The idea is that three or more people who are all genetic matches to each other likely share a limited number of common ancestors. By focusing on these “in common with” (ICW) matches (see glossary), one can narrow down to which of their many lineages a particular group of matches belongs, rather than trying to determine the common lineage one match at a time.
As discussed above in the In Common With (ICW) Matches section and shown in Table 4 of this study, Jewish participants had an average of 16.1 times more ICW matches with other study participants than did non-Jews, and 1.8 times more ICW matches than did individuals of mixed Jewish heritage. In turn, interfaith participants, reflecting the effect of Jewish matches, had an average of 9.1 times more ICW matches than non-Jewish study participants. As a result, applying triangulation techniques to Jewish matches becomes much more difficult.
For example, all matches in common with a known third cousin (who are also matches to each other) will share a common ancestor somewhere along one of the ancestral lines. The problem arises when an overwhelming number of matches are shared with a third cousin. It is difficult enough to determine common ancestral lines for a dozen or so common matches, but this becomes virtually impossible when there are more than a thousand common matches for every predicted genetic match, the vast majority of whom are speculative matches with fifth-to-remote cousins. This problem confronts people of Ashkenazic ancestry who wish to analyze their matches using triangulation.
Producing groups of matches in common and matches who share common segments used to be extremely tedious, even with the use of spreadsheets. The Autosomal DNA Segment Analyzer (ADSA) from DNAGedcom.com uses your FTDNA Family Finder match and segment data to produce a report that combines shared segments with matches in common. The result is a clear picture of groups of matches who likely all share a common ancestor. A streamlined portion of an ADSA report for a non-Jewish individual is shown in Figure 6.
ADSA reports indicate the match’s name and e-mail address (represented in the first column of Figure 6 as A through J), shared segment information (chromosome, start and end location, and segment length measured in cM) and the number of single nucleotide polymorphisms of SNPs. The report provides an ICW grid showing matches in common, color-coded by match. The Segments column of the report offers a graphic representation of the shared segments, also color-coded by match. Figure 6 shows three distinct groups of matches: A-B-C, D-E-F, and G-H-I-J. Genealogical information from the matches in each group may be used to confirm or identify a common ancestor.
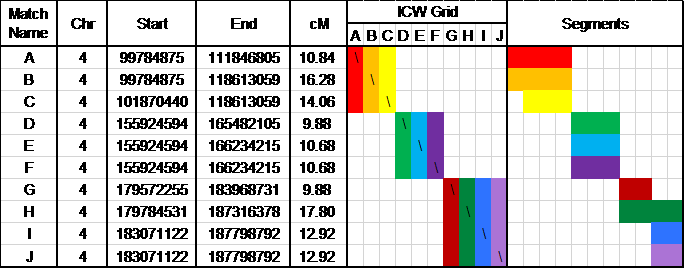
Fig. 6: Portion of ADSA Triangulation Report for a Non-Jewish Individual
The production and interpretation of an ADSA report for Ashkenazi Jews faces several challenges because of the extremely large number of ICWs. A streamlined portion of the ADSA report for a Jewish individual is shown in Figure 7.
One challenge is that the ADSA report produces so many matches for Ashkenazi Jews that the results are difficult to interpret. As discussed above in the Genetic Matches section, Ashkenazi Jews will match each other about 50 percent of the time. This results in no visually distinct groups, even though shared segments (shown in the Segments column of Figure 7) show separate groups of shared segments.
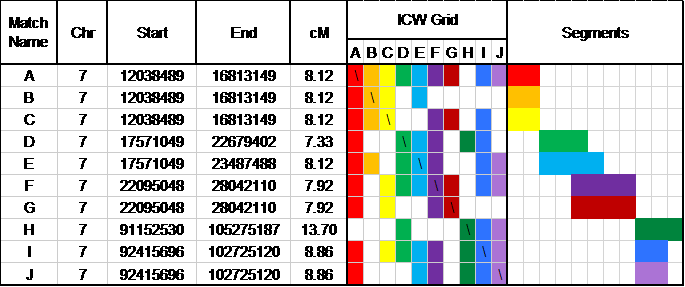
Fig. 7: Portion of ADSA Triangulation Report for a Jewish Individual
The other challenge is that the size of the combined ICW file for Ashkenazi Jews (approximately 3.8 million records, as compared to fewer than 100,000 records for non-Jewish matches) usually results in the ADSA application timing out. One of our recommendations to FTDNA is that it provide users a tool that will enable them to filter their ICW matches by relationship distance, thereby considerably narrowing the number of excess ICW matches for Ashkenazi Jews.
Discussion
These results confirm our hypothesis that Ashkenazi Jews share not only significantly more total autosomal DNA, but also significantly more DNA segments with their genetic matches in the Family Finder database than do non-Jews. Hence, belonging to an endogamous population, and the reinforcement and recombination of the genes due to frequent consanguineous marriage among related family members, does appear to result in increasing the total amount of shared DNA, and an effect on the size distribution of shared DNA segments between genetic matches for Ashkenazi Jews. This, in turn, alters the odds of inheritance, and significantly increases genetic match rates in successive generations.
The increased shared DNA among Ashkenazi Jews appears to be distributed among numerous smaller sized blocks, particularly in the 3 cM to 8 cM range, which contributes to significantly higher shared autosomal DNA values at more distant relationships. These higher shared autosomal DNA values result in the identification of many more genetic matches for Ashkenazi Jews, especially at more distant relationships. However, the vast majority of these distant matches are unlikely to be genealogically significant, or lead to the successful identification of a common ancestor who lived within a genealogically relevant time period.
The results of our study indicate that at low expected shared DNA percentages, the relationship between expected and observed shared autosomal DNA percentage becomes non-linear for the Jewish and interfaith study groups. The non-linear trend is evident at expected shared DNA values less than 1%, and becomes pronounced at expected shared DNA percentages less than 0.2%, which corresponds to a relationship distance at the 4th cousin level.
For the Jewish study group, the breakdown in the linear relationship below the 0.2% region is particularly pronounced, and may be due to a genetic background “noise” level resulting from multiple distant ancestral relationships. FTDNA, in their Ashkenazi FAQ document states:31
There are two factors in sharing between genetic cousins with multiple lines of descent from a common ancestor or multiple common ancestral lines. The first one is increased overall sharing. The amount of increased average sharing is additive. It is calculated by adding together the amounts of expected sharing for each known relationship. Thus, if you share two lines of descent with a cousin at the 4th cousin level, one line at the 4th cousin once removed level, and one line at the 7th cousin level, your expected sharing would be 0.195% + 0.195% + 0.098% + 0.003% = 0.491% rather than the 0.195% of a 4th cousin who is related in only one way.
The second factor when more than one line of descent in common is many smaller common identical by descent segments rather than the expected levels of some large, medium, and small segments. Over time and depending on the degree of intermarriage in the population, these blocks may become common to a significant percentage of the population group.
The key question then becomes what to do about the shared autosomal DNA and longest block values that are reported within the genetic background noise level for Ashkenazi Jews, and other endogamous populations. There are both advantages and disadvantages to reducing the genetic background noise level. The main advantage is increased reliability of matches and predicted relationships. The main disadvantage is that some useful genealogical information may be lost, as buried in the noise may be some authentic, although quite distant, ancestral relationships that may be of genealogical value.19
One viable option might be to focus on counting a number of the longest segments, rather than counting all segments. Further research will be needed to determine the ideal size ranges to focus analysis upon, but there is little doubt that both the specificity and accuracy of predicted relationships can be improved across the board by increasing the ratio of large-to-small shared segments in the analysis. The current Family Finder algorithm calculates a preliminary prediction from total shared DNA and longest block, then adjusts Ashkenazi matches by looking at longest block and second-longest block, but this adjustment could easily be extended to include additional DNA segments. This could help extend the range of the analysis, while serving to reduce the potential number of spurious matches in the non-linear region of the shared DNA distribution.
Additional research studies are needed to determine the ideal total shared DNA and segment size ranges upon which to focus current autosomal DNA analysis methods, with the goal of improving the accuracy of predicted relationship distances as well as extending the useful predictive range of the analysis for fifth cousins and beyond.
Another very useful option would be to provide additional analytic tools for evaluating autosomal DNA results. Family Finder’s Chromosome Browser is one such useful tool, recently extended from a limitation of looking at only five genetic matches at a time to being able to download the entire set of shared segments for all matches. Triangulation tools can help separate shared segments resulting from multiple ancestral relationship “noise” from small shared segments which may be of genealogical significance. Other “third party” tools such as admixture, phasing, and chromosome mapping, while helpful to all, would be of particular benefit to members of endogamous populations, in helping them to map the DNA of multiple ancestral lines, and identify more distant genetic cousins.
Yet another useful option would be to provide a screening tool which permits Ashkenazi Jews to filter their matches at a user-defined relationship distance. This would enable people focus their time and effort on those matches for which there is a realistic possibility of finding a common ancestor.
Such a tool would have other benefits as well. Current ICW match lists for Ashkenazi Jews contain so many matches that third-party tools such as those employed by DNAGedcom30 routinely crash when attempting to manipulate such large files. Enabling users to filter their match lists would help solve this problem.
Our initial analysis has demonstrated that the mean number of ICW matches for Jewish study participants decreases from 1370 to 240 if 4th-to-remote and 5th-to-remote cousins are eliminated from one individual’s match list; it decreases to 44 when they are eliminated from both sides. This would serve to eliminate the vast majority of spurious matches from the ICW lists for Ashkenazi Jews.
From one perspective, it is somewhat surprising that the autosomal DNA characteristics of the participants of the Jewish study group are so different from those of the non-Jewish study group. After all, nearly all of the participants in the Jewish study group are American Ashkenazi Jews, most of whom are more than a century removed from the shtetls of Russia and Eastern Europe, and the legal and cultural marriage restrictions of the time and place.
Seen in a broader context, however, the dramatic differences in autosomal DNA characteristics between Jewish and non-Jewish study participants are rooted in the endogamous nature of the Ashkenazi Jewish population.14 According to the study of Atzmon et al., as reported by Khan:1632
Jewish groups share a lot of the genome identical by descent (IBD). The authors noted that the segments identical by descent among Jews are rather small, which implies that recombination has broken up the large blocks. That means that a high proportion of Jewish-Jewish IDB is a function more of many common ancestors deep in the past, rather than a few more recent common ancestors. Ashkenazi Jews in particular exhibit increased sharing of the genome across short blocks as opposed to longer ones, suggestive of a demographic expansion from a small population. Genic regions were was also moderately enriched around the loci which were IDB, a possible indication of functional commonalities across Jewish populations.
Conclusions
The main conclusions of our study may be summarized as follows:
Recommendations
Autosomal DNA analysis is still is in its infancy, and more advanced, sophisticated methods of analyzing, evaluating and reporting the data undoubtedly will be developed in the future. In the interim, we propose several options for improving the sensitivity, precision and utility of the Family Finder test, particularly for endogamous populations such as the Ashkenazi Jewish population. These options include:
Suggested Future Research
Further studies of expected and observed shared autosomal DNA for known relationships are needed to determine whether the breakdown in the linear relationship between expected and observed values reported here, may result in spurious matches and inaccurate relationship predictions for endogamous populations, especially at the low end of the distribution. Such studies may better define the non-linear region of the distribution for different endogamous populations.
Additional research studies are needed to determine the ideal total shared DNA and segment size ranges upon which to focus current autosomal DNA analysis methods, with the goal of improving the accuracy of predicted relationship distances as well as extending the useful predictive range of the analysis for fifth cousins and beyond.
Such studies could also look at the effect of modifying the current shared autosomal DNA segment reporting threshold from a total of 20 cM, and the criteria for matching segments of 7.7 cM from their current values, with the goal of improving the accuracy of predicted relationship distances, as well as extending the useful predictive range of the analysis.
While always striving for accuracy in identifying genetic matches, and in predicting the relationship distance of those matches, it is important not to lose sight of the importance of improving the sensitivity of the Family Finder test. Increasing both the accuracy and sensitivity of autosomal DNA analysis are not mutually incompatible goals. As one genealogist expressed it: “When I see a Chromosome Browser comparison of five known relatives light up a spot at 3 cM but vanish at 5 cM, I have a very hard time allowing for the 3 cM tolerance to be dismissed as noise.“33 Based upon the results of the Wertheimer-Wertheim study, the lead author arrived at a similar conclusion regarding the potential genealogical significance of inherited “chromosome markers” – small DNA segments shared by known or likely descendants of a lineage at the identical location on a specific chromosome.19
In other words, small amounts of shared autosomal DNA can hold important genetic clues, and in the quest for improved accuracy, we do not want to give up on the equally important goal of improving the sensitivity of the Family Finder test, and extending its useful range.
The next generation of microarray chips will undoubtedly extend autosomal DNA analysis capabilities. As analysis capabilities expand, and databases continue to grow, we may be able to reconstruct portions of the genomes of our ancestors, especially those who have large numbers of descendants. Based on the rate that autosomal DNA analysis tools and techniques have advanced since the introduction of the Family Finder test in 2010, dreams of being able to map, phase, and link autosomal DNA segments to distant ancestors, may soon become a reality.
The results of this study apply to the Ashkenazi Jewish population, which is but one of many endogamous populations. It is recommended that similar studies of other endogamous populations be undertaken, and their results compared, with the ultimate goal of developing a universal adaptive model or algorithm for use in conducting autosomal DNA analyses of both endogamous and heterogeneous populations, with equal sensitivity and precision.
Acknowledgements
The authors wish to extend their gratitude to Bennett Greenspan, founder, President, and CEO of Family Tree DNA, for his cooperation and support over the course of our study. We also wish to thank all of the participants and project/DNA kit managers in our study groups for their significant contribution to our research study, and our distinguished panel of reviewers for their insightful review comments. This article was peer reviewed with 3 commentaries.References
- Mosk C. Nationalism and Economic Development in Modern Eurasia. Routledge, 2013, p.143: “The Ashkenazim originally came out of the Holy Roman Empire.”
Nationalism and Economic Development in Modern Eurasia - Smith DW, Burr EG. Understanding World Religions: A Road Map for Justice and Peace. Rowman & Littlefield, 2007, p. 72: "Before the German Holocaust, about 90% of Jews world-wide were Ashkenazim. Since the Holocaust, the percentage has dropped to about 83%.”
Understanding World Religions: A Road Map for Justice and Peace - Bittles, A.H.. Endogamy, Consanguinity and Community Disease Profiles. Community Genetics. 2005;8(1):17-20. DOI:10.1159/000083332.
http://dx.doi.org/10.1159/000083332 - Markel H. Di Goldine Medina (The Golden Land): historical perspectives of eugenics and the east European (Ashkenazi) Jewish-American community, 1880-1925. Health Matrix Clevel. 1997 Winter;7(1):49-64. PubMed PMID:10167178.
http://www.ncbi.nlm.nih.gov/pubmed/10167178 - Kahn SM. Are Genes Jewish? Conceptual Ambiguities in the New Genetic Age. Jean and Samuel Center for Judaic Studies, p. 1-17, March 16, 2005.
Are Genes Jewish? / Conceptual Ambiguities in the New Genetic Age - Feder, Jeanette, Ovadia, Ofer, Glaser, Benjamin, Mishmar, Dan. Ashkenazi Jewish mtDNA haplogroup distribution varies among distinct subpopulations: lessons of population substructure in a closed group. European Journal of Human Genetics. 2007
2007
;15(4):498-500. DOI:10.1038/sj.ejhg.5201764.
http://dx.doi.org/10.1038/sj.ejhg.5201764 - Katsnelson, Alla. Jews worldwide share genetic ties. Nature. 2010. DOI:10.1038/news.2010.277.
http://dx.doi.org/10.1038/news.2010.277 - Burchard, Esteban González, Ziv, Elad, Coyle, Natasha, Gomez, Scarlett Lin, Tang, Hua, Karter, Andrew J., Mountain, Joanna L., Pérez-Stable, Eliseo J., Sheppard, Dean, Risch, Neil. The Importance of Race and Ethnic Background in Biomedical Research and Clinical Practice. New England Journal of Medicine. 2003;348(12):1170-1175. DOI:10.1056/nejmsb025007.
http://dx.doi.org/10.1056/nejmsb025007 - Goodman RM. Genetic Disorders among the Jewish People. The Johns Hopkins University Press, 1979, Baltimore, MD.
Genetic Disorders among the Jewish People - Risch, Neil, Tang, Hua, Katzenstein, Howard, Ekstein, Josef. Geographic Distribution of Disease Mutations in the Ashkenazi Jewish Population Supports Genetic Drift over Selection. The American Journal of Human Genetics. 2003;72(4):812-822. DOI:10.1086/373882.
http://dx.doi.org/10.1086/373882 - Mozersky, Jessica. Who’s to blame? Accounts of genetic responsibility and blame among Ashkenazi Jewish women at risk of BRCA breast cancer. Sociology of Health & Illness. 2012
2012
;34(5):776-790. DOI:10.1111/j.1467-9566.2011.01427.x.
http://dx.doi.org/10.1111/j.1467-9566.2011.01427.x - FTDNA is an abbreviation for Gene By Gene, Ltd doing business as Family Tree DNA, a commercial provider of genealogical DNA testing in Houston, Texas. Family Tree DNA Learning Center: Jewish Ancestry.
https://www.familytreedna.com/learn/jewish-dna-testing/autosomal-dna-research-challenging/ - THOMAS, M. Founding Mothers of Jewish Communities: Geographically Separated Jewish Groups Were Independently Founded by Very Few Female Ancestors. The American Journal of Human Genetics. 2002;70(6):1411-1420. DOI:10.1086/340609.
http://dx.doi.org/10.1086/340609 - BEHAR, D, METSPALU, E, KIVISILD, T, ACHILLI, A, HADID, Y, TZUR, S, PEREIRA, L, AMORIM, A, QUINTANAMURCI, L, MAJAMAA, K. The Matrilineal Ancestry of Ashkenazi Jewry: Portrait of a Recent Founder Event. The American Journal of Human Genetics. 2006;78(3):487-497. DOI:10.1086/500307.
http://dx.doi.org/10.1086/500307 - Need, Anna C, Kasperavičiūtė, Dalia, Cirulli, Elizabeth T, Goldstein, David B. A genome-wide genetic signature of Jewish ancestry perfectly separates individuals with and without full Jewish ancestry in a large random sample of European Americans. Genome Biology. 2009;10(1):R7. DOI:10.1186/gb-2009-10-1-r7.
http://dx.doi.org/10.1186/gb-2009-10-1-r7 - Atzmon, Gil, Hao, Li, Pe'er, Itsik, Velez, Christopher, Pearlman, Alexander, Palamara, Pier Francesco, Morrow, Bernice, Friedman, Eitan, Oddoux, Carole, Burns, Edward, Ostrer, Harry. Abraham's Children in the Genome Era: Major Jewish Diaspora Populations Comprise Distinct Genetic Clusters with Shared Middle Eastern Ancestry. The American Journal of Human Genetics. 2010;86(6):850-859. DOI:10.1016/j.ajhg.2010.04.015.
http://dx.doi.org/10.1016/j.ajhg.2010.04.015 - Wade N. Studies Show Jews’ Genetic Similarity. The New York Times, June 9, 2010.
http://www.nytimes.com/2010/06/10/science/10jews.html - Gelles E. Autosomal DNA Matches between Close Cousins. The Galitzianer, Volume 19, No.1, March 2012.
http://www.geshergalicia.org/galitzianer/ - Paull JM, Akaha JB. Using Autosomal DNA Analysis to Connect Rabbinical Lineages: A Case Study of the Wertheimer and Wertheim Dynasties. AVOTAYNU: The International Review of Jewish Genealogy, Volume XXVIII, Number 4, Winter, 2012.
http://www.academia.edu/3877962 - Canada RA. How many generations does Family Finder analyze or predict? FTDNA January 1, 2014.
https://www.familytreedna.com/learn/autosomal-ancestry/universal-dna-matching/generations-family-finder-analyzes/ - Rosenstein N. Ashkenazic Rabbinic Families. AVOTAYNU: The International Review of Jewish Genealogy, Fall 1987.
http://www.jewishgen.org/rabbinic/journal/ashkenazic.htm - Genome Reference Consortium: Human Genome Build 37
http://www.ncbi.nlm.nih.gov/projects/genome/assembly/grc - Behar, Doron M., Yunusbayev, Bayazit, Metspalu, Mait, Metspalu, Ene, Rosset, Saharon, Parik, Jüri, Rootsi, Siiri, Chaubey, Gyaneshwer, Kutuev, Ildus, Yudkovsky, Guennady, Khusnutdinova, Elza K., Balanovsky, Oleg, Semino, Ornella, Pereira, Luisa, Comas, David, Gurwitz, David, Bonne-Tamir, Batsheva, Parfitt, Tudor, Hammer, Michael F., Skorecki, Karl, Villems, Richard. The genome-wide structure of the Jewish people. Nature. 2010
2010
;466(7303):238-242. DOI:10.1038/nature09103.
http://dx.doi.org/10.1038/nature09103 - Cann, H. M.. A Human Genome Diversity Cell Line Panel. Science. 2002;296(5566):261b-262. DOI:10.1126/science.296.5566.261b.
http://dx.doi.org/10.1126/science.296.5566.261b - Rosenberg, N. A.. Genetic Structure of Human Populations. Science. 2002;298(5602):2381-2385. DOI:10.1126/science.1078311.
http://dx.doi.org/10.1126/science.1078311 - Estes R. Family Tree DNA Releases myOrigins. DNAexplained – Genetic Genealogy, May 8, 2014.
http://dna-explained.com/2014/05/11/family-tree-dna-releases-myorigins/ - Khan R, Hu Rui, myOrigins. FTDNA White Paper
https://www.familytreedna.com/learn/family-finder-pages/myorigins-methodology/ - Greenspan B. Differences in Autosomal DNA Characteristics between Jewish and non-Jewish Populations. Email correspondence with Jeffrey Mark Paull, February 17, 2014.
- Canada RA. What percentage of our common ancestors' DNA do I share with my cousin? FTDNA October 19, 2013.
https://www.familytreedna.com/learn/autosomal-ancestry/universal-dna-matching/percentage-common-ancestors-dna-share-cousin/ - GEDmatch.com. Ad-Mix Utilities
http://ww2.gedmatch.com:8006/autosomal/ap_mix1_gen.php - Canada RA. How does it affect my results if some of my ancestors married their relatives? FTDNA, January 1, 2014.
https://www.familytreedna.com/learn/autosomal-ancestry/universal-dna-matching/ancestors-married-relatives-affect-results/ - Khan R. Genetics & the Jews. Disovery Magazine, Gene Expression, June 6, 2010.
http://blogs.discovermagazine.com/gnxp/2010/06/genetics-the-jewish-question/#.UdvK6flnF8E - Kenan R. Review of our Autosomal DNA Research Study: Differences in Autosomal DNA Characteristics Between Jewish and Non-Jewish Populations. Email correspondence with Jeffrey Mark Paull, March 3, 2014.
Leave a Comment
You must be logged in to post a comment.