Introduction
As a DNA Project administrator, I am often asked how to interpret someone’s Y-DNA results in terms of the participants expectations and curiosity as to “what country do I come from?” One aspect that new participants in the field of genetic genealogy may not appreciate is the wide variance in how much DNA has been sampled from various ethnic groups, populations, and geographical countries. While the major consumer DNA testing labs like Ancestry.com and 23andMe have worked extensively to extend their sample population data for autosomal admixture tests, relatively little attention is paid to Y-DNA database population sourcing. In order to help participants realize the sampling context of the current Y-DNA database, here is an analysis of the largest Y-DNA database – the database at Family Tree DNA (a dba for Gene by Gene, Ltd, aka FTDNA).
Methodology
Using the Y-DNA Haplotree at FTDNA, one can now get figures for how many samples have been collected at each node of the phylogenetic tree and all the children nodes (dubbed ‘All Downstream Participants’). Note that in order to appear on the FTDNA tree, the participant had to have at least one SNP test performed. The participant also has to have opted-in to matching other participants in order to appear in the figures. Individual participants are assigned to the tree based on their Y-DNA ‘terminal SNP’ — the most unique SNP they have positive results for which is also on the phylogenetic tree.
For geography, participants are asked to write the name of the country of their earliest known paternal ancestor when submitting their sample. Persons from former colonies like the United States are asked to make an attribution back to an old world country unless they are Native American. Of course some participants do not make a country attribution and some pick United States anyway. Using a snapshot of the data from 17 January 2019 there were 164,546 Y-SNP sample attributions but 70,517 had ‘Unknown Origins’, leaving a result set of 94,029 samples attributed to one of 180 countries.
While the raw number of samples collected and attributed to an individual country is important, we should also be mindful of how well the population of all Y-DNA lineages have been sampled in any given country. In other words, what is the sampling penetration for each country? For if a participant has no Y-DNA matches but comes from a country that has barely been sampled, we cannot make any inference as to how common or rare that Y-DNA lineage truly is. On the other hand, if a country has been extensively sampled and we find an unmatched lineage from that country – it is indeed probably rare.
To get a measure of sampling penetration by country, a metric was devised to divide the number of Y-SNP samples attributed to that country by its modern population estimate drawn from United Nations figures. The resulting measurement of sample density is expressed as Y-SNP attributed samples per million of population. We understand that only a fraction of these samples were physically collected in a given country and that the time period of the ancestral attribution varies and is generally not the same as the time frame of the current population figures. Nonetheless, these per million capita figures do give us some numerical context on how well each nation is represented in the FTDNA database.
Results
Attributed Sample Count
Top Countries in the World by Attributed Sample Count
As illustrated in Figure 1, the United Kingdom had the most sample attributions with 22,930 (24% of identified attributions), followed by the Republic of Ireland 7,886 (8%), and Germany 7,393 (8%). Some countries which made the top 25 list and which might surprise you included Saudi Arabia 4,118 (4%), Russia 3,666 (4%), and Turkey 742 (1%).
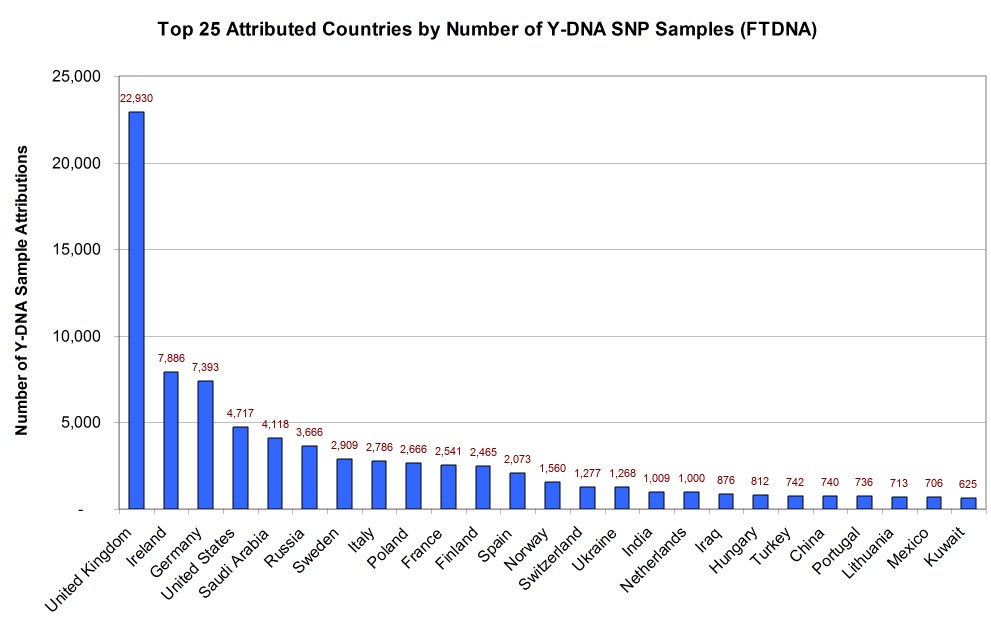
Figure 1 Vertical bar chart illustrating the top 25 countries by attributed Y-SNP sample count of earliest paternal ancestor at Family Tree DNA. Population data from United Nations 2017 World Population Prospects on Wikipedia https://en.wikipedia.org/w/index.php?oldid=879939654
Attributed Sample Count for European Countries
As many FTDNA customers have European ancestry, a chart illustrating the number of samples for the most populous European countries is presented in Figure 2 below. The order of the countries is in descending order of their modern population. Here we see that although the Republic of Ireland is at the bottom of the list as the 26th most populous European country, it has the second highest total of Y-SNP samples, reflecting the genealogical interest of descendants from a country which experienced a population diaspora in the 19th century.
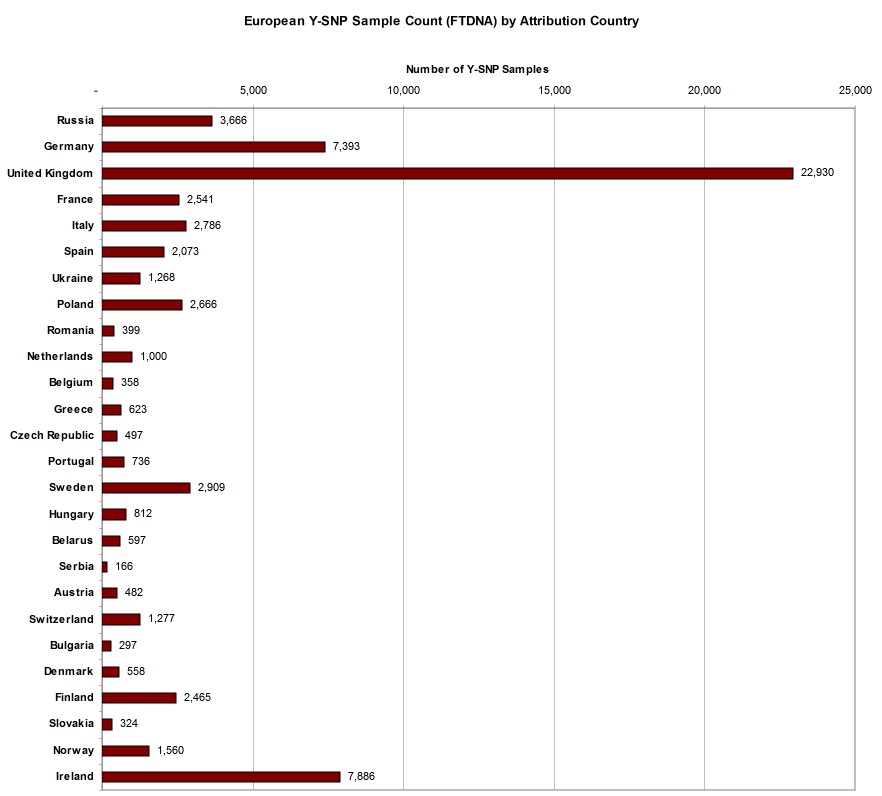
Figure 2 Horizontal bar chart of the most populous European countries and the number of Y-DNA samples attributed to those countries. The order of the countries is in descending order of their modern population.
Estimates for Sampling Density
Most Densely Y-DNA Sampled Countries
Taking the current population of each country as a denominator and expressing the number of Y-SNP sample attributions as the number per million population gives us a good metric for comparing countries by sampling penetration. Figure 3 shows us the most densely sampled countries in the world (minimum one million in population). Here the Republic of Ireland clearly leads with 1,656 Y-SNP sample attributions per million of population. Next, however, is Finland (446 samples per million) and the United Kingdom (346 samples per million).
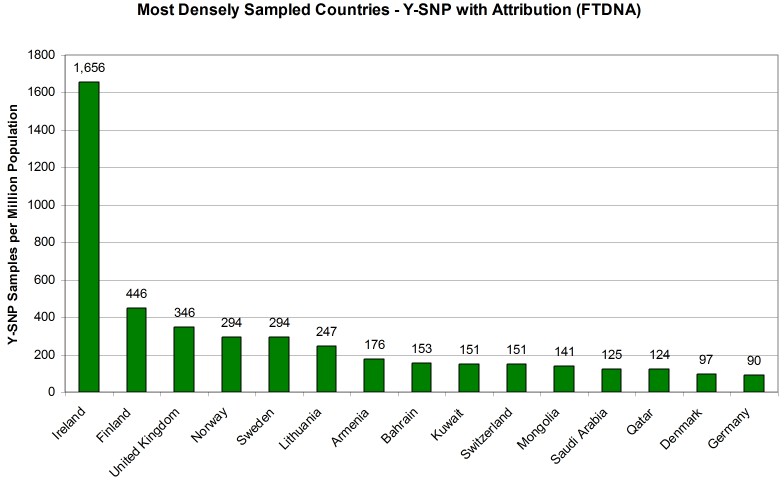
Figure 3 Vertical bar chart illustrating the top 25 most densely sampled countries for Y-DNA results with SNPs.
Sample Density of the Most Populous Countries
While there are many countries with zero or very few Y-DNA sample attributions at FTDNA, we’ll focus on the largest countries with very low sample density. Table 1 below describes the 19 countries who have an estimated population of 80 million or greater. The developing nations of Bangladesh, Ethiopia, and Congo are unsurprisingly the least sampled at FTDNA. But even some developed countries with a history of some emigration to the United States have low representation in the FTDNA customer database such as China, India, Nigeria, Brazil, Vietnam, and Pakistan who all have a sample density of only one (1) Y-SNP DNA sample attribution per million of population. Among other countries that have historically had significant emigration to the United States, Mexico has only five (5) Y-DNA samples per million population; Japan 3 per million; and the Philippines 2 per million.
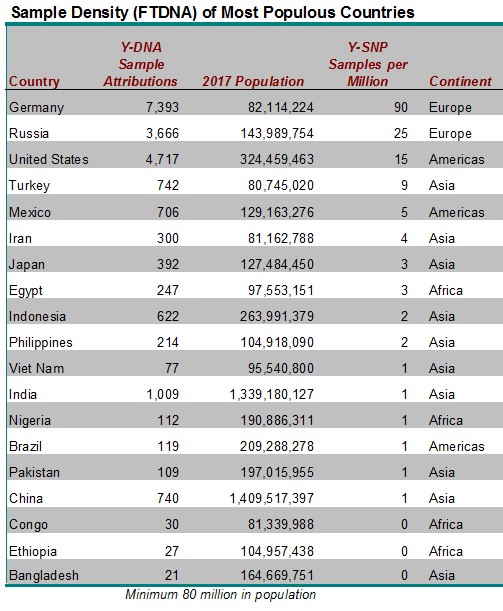
Table 1 Y-DNA sample attribution combined with population for the most populous countries.
Sample Density of European Countries
Figure 4 below shows the important consideration that sampling density represents for Y-DNA testers who are seeking ancestry in Europe but outside of the British Isles. Again the order of countries (from left to right) is by total population and it shows the wide variance in sampling density.
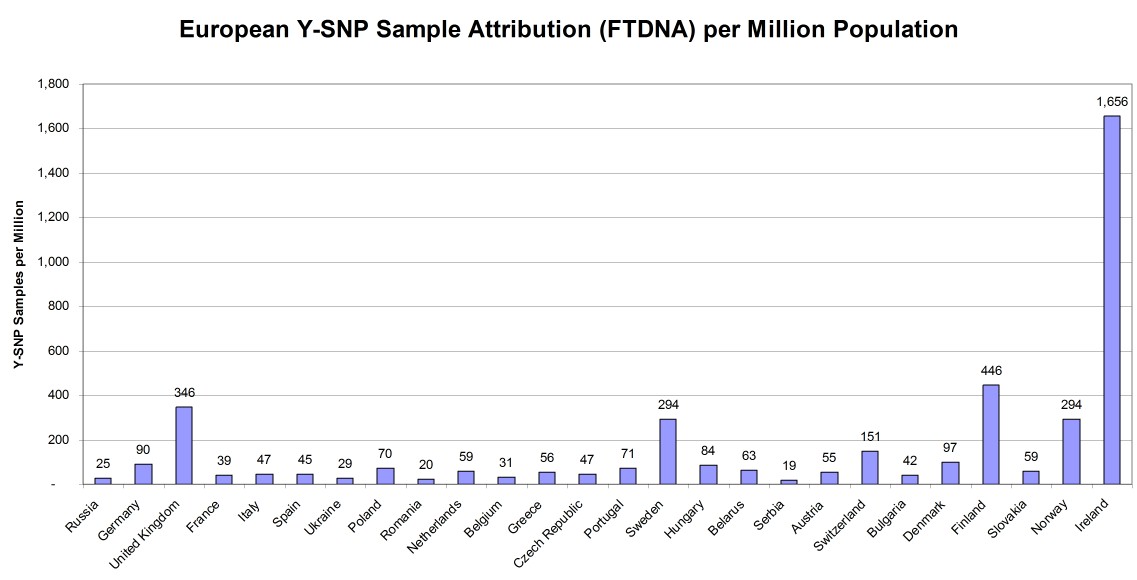
Figure 4 Vertical bar chart of the Y-DNA sample count in the FTDNA database expressed as the number of samples per million in modern population.
Breakout of British Isles and Native American Figures
As already stated, the modern country with the most Y-SNP sample attributions is the United Kingdom of England, Wales, Scotland, and Northern Ireland. When combined with the Republic of Ireland, we get a figure of 441 Y-SNP sample attributions per million for the British Isles as a whole. Scotland has a healthy sample rate of 1,101 attributed samples per million which was driving the national value for the United Kingdom. The sample density for Wales (299 per million) and England (203 per million) as shown in Figure 5 are actually less than that for U.S. Native American attribution (316 per million). So perhaps surprisingly, Native Americans are better represented in the FTDNA database than might have been suspected. [Reference: Countries of the United Kingdom by population on Wikipedia https://en.wikipedia.org/w/index.php?oldid=869454643]
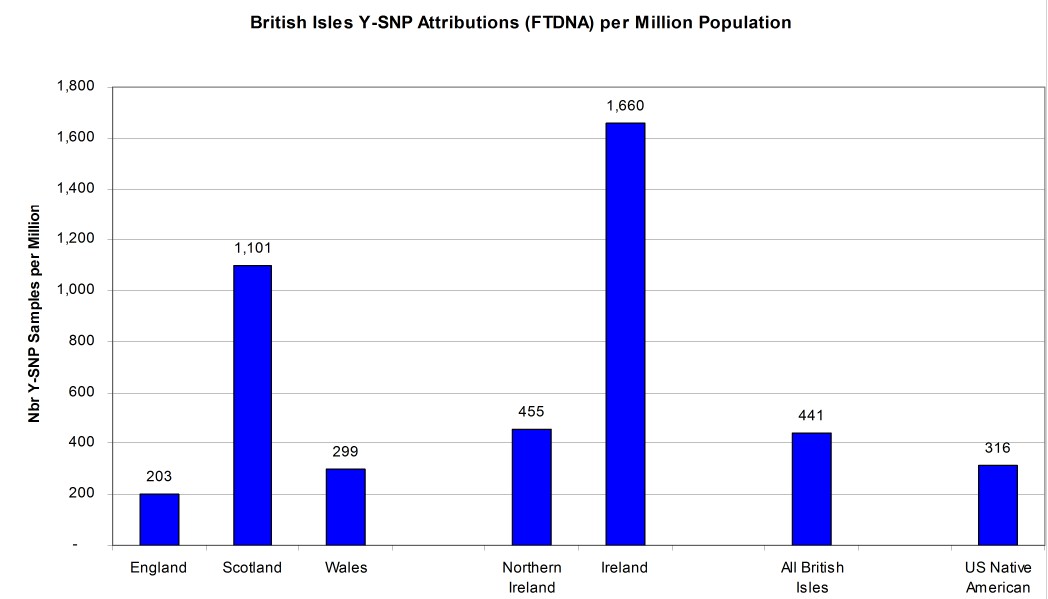
Figure 5 Y-SNP DNA samples attributed to regions of the British Isles per million of population. U.S. Native American sampling per million of population is also shown for comparison.
Results by Genetic Haplogroup
Comparing Sample Count by Y-SNP Haplogroup
Using the Country Reports at the nodes of the major Y-DNA haplogroups on the FTDNA Y-DNA Haplotree [Reference: https://www.familytreedna.com/public/y-dna-haplotree], we can see that there are at least 166,380 Y-SNP samples in the FTDNA database as of 27 February 2019. Note that this SNP-based count excludes samples which have only STRs tested or those from participants who have opted-out of matching others in the database. Based on the current total of 702,337 Y-DNA records of all types – indicates that a fraction of about 26% of all Y-DNA records have at least one SNP test. [Reference: https://www.familytreedna.com/why-FTDNA.aspx]
As illustrated in the histogram (Figure 6) and pie chart (Figure 7) below, the distribution among haplogroups is not symmetrical and reflects the demographics of FTDNA’s American customer base: 44% of the Y-SNP samples are from haplogroup R, 19% from haplogroup I, 14% from haplogroup J, and 8% from haplogroup E.
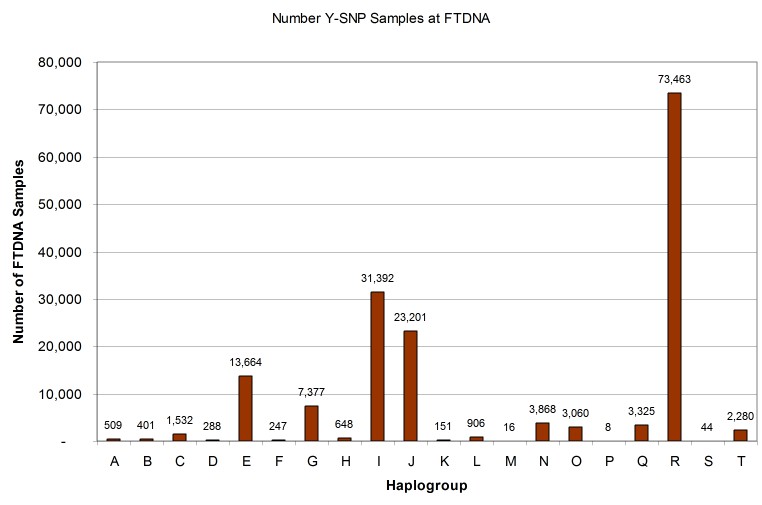
Figure 6 Vertical bar chart of the number of samples by Y-DNA SNP haplogroup at FTDNA as of 27 Feb 2019.
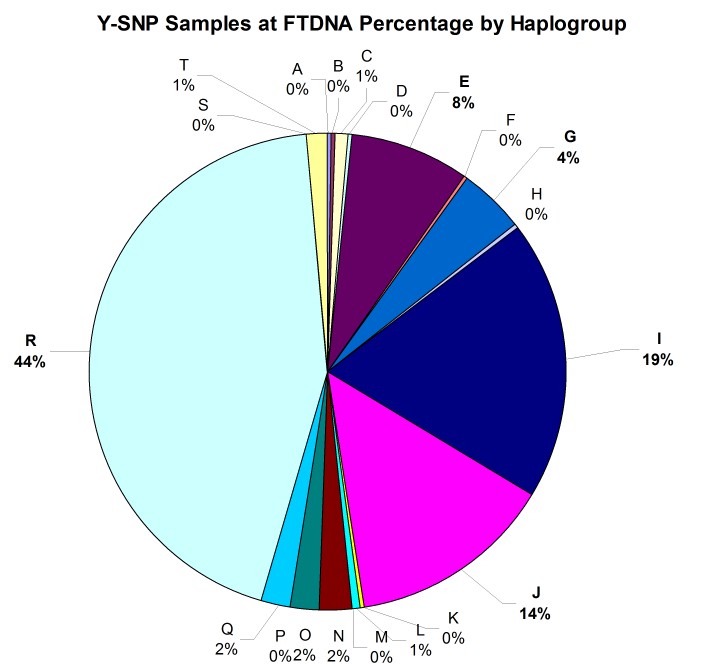
Figure 7 Pie Chart of Y-SNP sample count by haplogroup.
We can also revisit the question of how well Native Americans are sampled by using genetic haplogroups instead of attributed country. Taking the sample count of haplogroup Q (the most common Y haplotype among Native Americans) as a rough proxy for Native American Y-DNA in the database implies a sampling density of 1,280 samples per million of population – actually higher than Scotland or any country except Ireland.
Y-Haplotree Branch Count
Another perspective on interpreting Y-DNA SNP results is to consider the state of development of the phylogenetic tree branch where an individual’s terminal SNP has been classified. Since phylogenetic trees must be derived from comparison of DNA samples with and without a given marker, the tree branch counts naturally reflect the sampling totals by haplogroup as illustrated in Figure 8. There are some haplogroups like R, I, and J which are much more fully discovered than others like C and O which likely have tens of thousands of SNP branches yet to be discovered as they are found in very large populations such as China but are not well represented in the FTDNA database. In other words, we expect that haplogroup O, will eventually have more branches than haplogroup R because there are likely more men carrying haplogroup O Y-DNA than carrying haplogroup R Y-DNA.
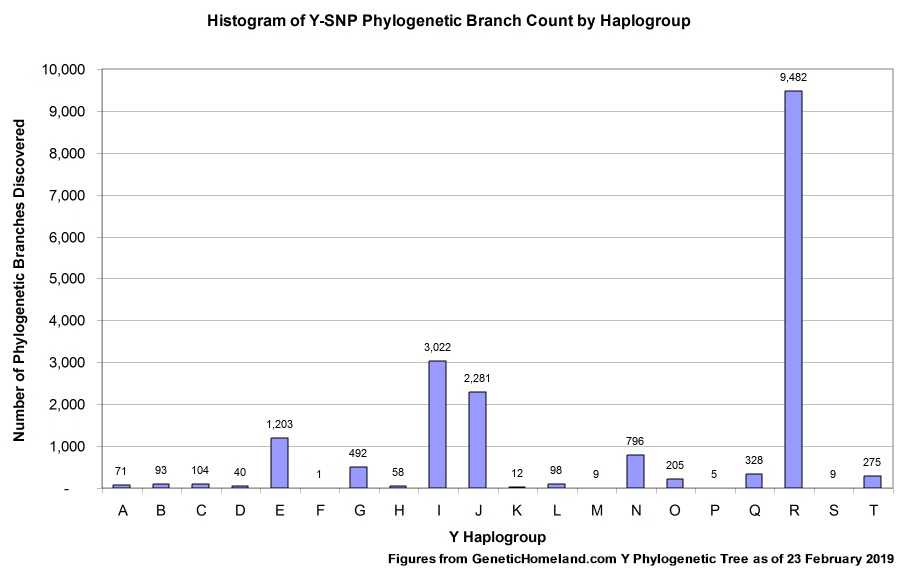
Figure 8 Histogram comparing number of phylogenetic branch points by Y-DNA haplogroup on the Genetic Homeland Ancestral DNA Marker Pedigree tool as of 23 Feb 2019.
Summary
The strong sampling effort of British Isles Y-DNA lineages will eventually be matched with increased sampling penetration around the world. It will take a combination of reduced laboratory test fees as well as energetic sampling initiatives by genetic genealogy leaders in new communities. Until that sampling parity is reached, however, the interpretation of Y-DNA results in terms of geography and phylogenetic resolution needs to take into account the characteristics of the database being used for matching.